










Kranti Industries H1 PAT falls 75% despite 21% revenue rise
Key highlights
- Kranti Industries’ H1 FY27 revenue increased 21.4% to Rs 50.622 crore.
- Kranti Industries’ H1 FY27 PAT fell 74.6% to Rs 50 lakh.
- Kranti Industries’ H1 FY27 EBITDA margin declined to 13.2% from 17.3%.
- Kranti Industries reported Q2 FY27 PAT of Rs 55.5 lakh after a Rs 5.5 lakh Q1 loss.
powered by IRIS
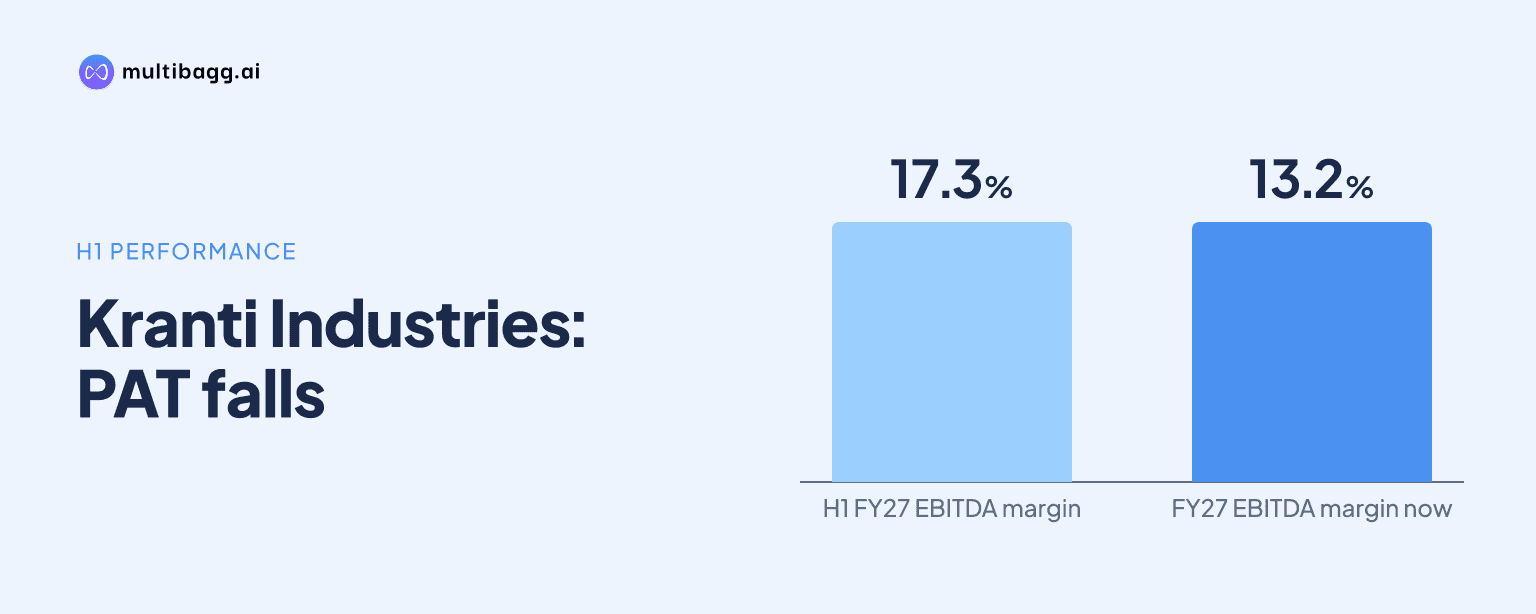
Kranti Industries Limited reported first-half FY27 (H1 FY27) revenue of Rs 50.622 crore, up 21.4% year on year, while profit after tax (PAT) fell 74.6% to Rs 50 lakh. Earnings before interest, tax, depreciation and amortisation (EBITDA) margin fell 415 basis points to 13.2%, and finance cost rose to Rs 2.458 crore.
Know Kranti Industries inside out
Results, valuation, peers and who's buying, in one view.
What drove Kranti Industries’ H1 FY27 revenue growth?
Kranti Industries’ H1 FY27 revenue rose to Rs 50.622 crore from Rs 41.702 crore in H1 FY26, an increase of 21.4%. Gross profit increased 38.2% to Rs 26.28 crore from Rs 19.02 crore, lifting gross margin to 51.9% from 45.6%, an improvement of 630 basis points. Chairman and Managing Director Sachin Subhash Vora attributed the gross-profit improvement to cost optimisation and inventory management.
The second quarter of FY27 (Q2 FY27) contributed Rs 25.156 crore of H1 revenue, 16.4% above Rs 21.62 crore in Q2 FY26 but 1.2% below Rs 25.466 crore in Q1 FY27. Q2 gross profit rose 33.8% year on year to Rs 13.67 crore and increased 8.4% from Rs 12.61 crore in Q1 FY27. Gross margin reached 54.3%, compared with 47.2% a year earlier and 49.5% in the preceding quarter.
Why did Kranti Industries’ H1 FY27 PAT decline?
Kranti Industries’ H1 FY27 PAT was Rs 50 lakh, compared with Rs 1.966 crore in H1 FY26. PAT margin fell to 1.0% from 4.7%, a decline of 373 basis points. EBITDA declined 7.7% to Rs 6.677 crore even as revenue rose 21.4%, reducing EBITDA margin to 13.2% from 17.3% in the prior-year half.
Operating expenses, finance cost and depreciation were higher in H1 FY27. Employee expenses increased to Rs 10.72 crore from Rs 6.437 crore, while other expenses rose to Rs 8.882 crore from Rs 5.354 crore. Finance cost increased to Rs 2.458 crore from Rs 1.738 crore and depreciation rose to Rs 4.057 crore from Rs 3.295 crore. Profit before tax declined 75.0% to Rs 69.1 lakh from Rs 2.764 crore, while profit before depreciation and tax declined 21.6% to Rs 4.748 crore.
Did Kranti Industries return to profit in Q2 FY27?
Kranti Industries returned to a positive PAT of Rs 55.5 lakh in Q2 FY27 after reporting a PAT loss of Rs 5.5 lakh in Q1 FY27. Profit before tax also turned positive at Rs 82.9 lakh, compared with a loss before tax of Rs 13.8 lakh in the preceding quarter. EBITDA increased 32.2% sequentially to Rs 3.801 crore from Rs 2.876 crore.
Q2 FY27 EBITDA margin improved by 382 basis points sequentially to 15.1% from 11.3% in Q1 FY27. Profit before depreciation and tax rose 56.5% quarter on quarter to Rs 2.897 crore, with its margin increasing to 11.5% from 7.3%. However, Q2 remained below Q2 FY26: EBITDA was 6.1% lower than Rs 4.047 crore, PAT was 57.3% below Rs 1.299 crore, and PAT margin was 2.2% against 6.0%.
Got a follow-up? Ask IRIS
What changed in Kranti Industries’ balance sheet by H1 FY27?
Kranti Industries reported total assets of Rs 125.603 crore at H1 FY27, compared with Rs 122.724 crore at FY26. Current assets increased to Rs 54.978 crore from Rs 52.555 crore, while non-current assets rose to Rs 70.625 crore from Rs 70.17 crore. Property, plant and equipment increased to Rs 46.824 crore from Rs 45.118 crore, whereas right-of-use assets declined to Rs 7.237 crore from Rs 9.305 crore.
Inventory increased to Rs 38.923 crore at H1 FY27 from Rs 29.882 crore at FY26, while trade receivables decreased to Rs 11.189 crore from Rs 18.089 crore. Combined current and non-current borrowings were Rs 43.964 crore, compared with Rs 41.835 crore at FY26. Equity increased to Rs 46.452 crore from Rs 45.907 crore, while cash was Rs 10.7 lakh at H1 FY27, compared with Rs 13.2 lakh at FY26.
Which markets matter most to Kranti Industries’ revenue mix?
Kranti Industries’ disclosed FY26 standalone segmental revenue mix was led by tractors, which accounted for 64.7% of revenue. Construction equipment represented 15.4%, while other categories accounted for 11.5%. The tractor and construction-equipment segments together represented 80.1% of FY26 standalone segmental revenue.
Electric vehicles accounted for 5.3% of FY26 standalone segmental revenue, compared with 1.2% for commercial vehicles, 0.6% for agricultural implements and 1.3% for new product development. Management said the outlook across automotive, agricultural equipment and construction equipment was encouraging, citing infrastructure development, evolving customer requirements and electric-vehicle adoption. Its stated focus includes capacity utilisation, cost discipline, operational efficiency and product quality.
Conclusion
Kranti Industries’ H1 FY27 results show revenue and gross profit expanding while earnings declined sharply. Revenue rose by Rs 8.92 crore year on year and gross margin improved by 630 basis points, but EBITDA declined by Rs 55.5 lakh, finance cost increased by Rs 72 lakh and PAT declined by Rs 1.466 crore. The reported figures show that higher operating, financing and depreciation charges outweighed the sales and gross-profit gains.
The next reported indicators to watch are whether Q2 FY27 EBITDA margin of 15.1% can improve on the H1 level of 13.2%, and whether management’s stated focus on capacity utilisation, cost discipline and efficiency affects earnings. Finance cost after borrowings reached Rs 43.964 crore, inventory stood at Rs 38.923 crore, and tractors accounted for 64.7% of FY26 segmental revenue.