










Liotech FY26 revenue rose to Rs 70.09 crore as cash flow grew
Key highlights
- Liotech's FY26 revenue rose to Rs 70.09 crore from Rs 40.68 crore in FY25.
- FY26 operating cash flow increased to Rs 6.48 crore from Rs 2.62 crore in FY25.
- Fixed assets reached Rs 12.58 crore in FY26, up from Rs 6.60 crore in FY25.
- Liotech's current ratio declined to 1.26 times in FY26 from 1.65 times in FY25.
powered by IRIS
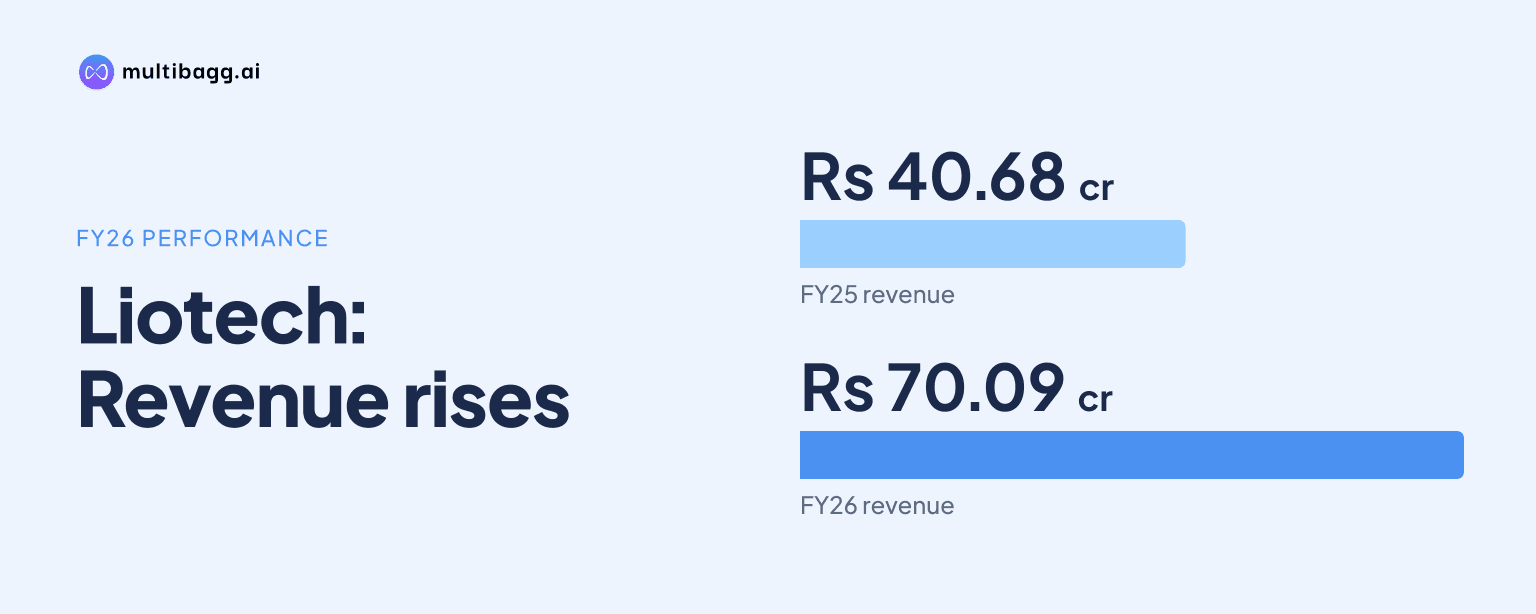
Liotech reported FY26 revenue of Rs 70.09 crore, up from Rs 40.68 crore in FY25, while cash flow from operations increased to Rs 6.48 crore and fixed assets reached Rs 12.58 crore. The presentation shows a scale-up in manufacturing activity alongside greater investment and a higher current-liability base.
Know Liotech Industries inside out
Results, valuation, peers and who's buying, in one view.
How fast did Liotech's revenue grow in FY26?
Liotech's revenue grew to Rs 70.09 crore in FY26 from Rs 40.68 crore in FY25 and Rs 27.86 crore in FY24. The FY26 outcome was the largest revenue figure in the three-year statement, adding Rs 29.41 crore from FY25. Other income also increased to Rs 0.41 crore in FY26, compared with Rs 0.01 crore in each of FY24 and FY25, taking total income to Rs 70.50 crore.
The expansion came with higher operating inputs. Raw-material costs rose to Rs 57.67 crore in FY26 from Rs 32.65 crore in FY25, while employee costs increased to Rs 1.93 crore from Rs 1.21 crore. Other expenses were Rs 0.50 crore, against Rs 0.26 crore a year earlier, and total expenditure reached Rs 60.10 crore versus Rs 34.12 crore. Liotech says it supplies more than 150 hardware and engineering products, including door kits, hinges, latches and bolts.
What happened to Liotech's profit in FY26?
Liotech's earnings before interest, tax, depreciation and amortisation, or EBITDA, rose to Rs 10.80 crore in FY26 from Rs 6.58 crore in FY25, while profit before tax rose to Rs 8.50 crore from Rs 5.60 crore. Finance costs increased to Rs 0.47 crore from Rs 0.32 crore, and depreciation more than doubled to Rs 1.43 crore from Rs 0.65 crore. Fixed assets expanded to Rs 12.58 crore during FY26.
Net profit was Rs 10.65 crore in FY26, compared with Rs 6.42 crore in FY25 and Rs 4.31 crore in FY24. Tax expense rose to Rs 2.18 crore from Rs 1.49 crore, while diluted earnings per share increased to Rs 21.07 from Rs 13.69. The subsequent H1 FY27 financial tables reported net profit of Rs 3.54 crore, down from Rs 3.71 crore in H1 FY26, despite EBITDA rising to Rs 6.21 crore from Rs 5.70 crore.
How did Liotech's fixed assets and working capital change?
Liotech's fixed assets increased to Rs 12.58 crore at FY26, from Rs 6.60 crore at FY25 and Rs 4.04 crore at FY24. This Rs 5.98 crore year-on-year increase coincided with investment cash outflow of Rs 7.40 crore in FY26, compared with Rs 3.20 crore in FY25. The presentation does not break down the investment cash-flow line by asset type, so it does not establish how much of that outflow related directly to fixed assets.
Working-capital balances also rose during FY26. Inventory increased to Rs 9.56 crore from Rs 7.15 crore, and trade receivables rose to Rs 8.02 crore from Rs 5.91 crore. On the liabilities side, trade payables were Rs 6.11 crore versus Rs 3.65 crore, current borrowings were Rs 5.66 crore versus Rs 2.92 crore, and other current liabilities were Rs 2.94 crore after Rs 0.01 crore in FY25. Current assets totalled Rs 21.01 crore, while current liabilities totalled Rs 16.71 crore.
Got a follow-up? Ask IRIS
Did Liotech's operating cash generation keep pace with expansion?
Liotech generated Rs 6.48 crore of cash flow from operations in FY26, compared with Rs 2.62 crore in FY25 and an outflow of Rs 0.52 crore in FY24. That operating cash inflow was partly offset by Rs 7.40 crore of investment cash outflow. Cash flow from financing was Rs 0.97 crore in FY26, after Rs 0.35 crore in FY25 and Rs 3.03 crore in FY24.
The presentation's operating measures moved in different directions. Receivable days fell to 41.79 in FY26 from 53.00 in FY25, and inventory days declined to 60.48 from 79.97. However, the current ratio, which compares current assets with current liabilities, declined to 1.26 times from 1.65 times, reflecting the faster increase in short-term obligations. The debt-to-equity ratio fell to 0.34 times from 0.40 times, while interest coverage was 18.28 times compared with 18.47 times.
What does Liotech's FY26 balance sheet indicate?
Liotech's net worth rose to Rs 16.75 crore in FY26 from Rs 10.43 crore in FY25, as reserves increased to Rs 13.75 crore from Rs 7.43 crore while equity remained Rs 3.00 crore. Long-term borrowing was not shown for FY26 after being Rs 1.30 crore in FY25. Deferred tax liability was Rs 0.12 crore, compared with Rs 0.07 crore a year earlier.
The balance-sheet presentation shows total current liabilities of Rs 16.71 crore in FY26, more than double Rs 7.97 crore in FY25. Short-term provisions increased to Rs 2.00 crore from Rs 1.39 crore, adding to current borrowings, payables and other current liabilities. Liotech reported return on equity of 46.50% in FY26, down from 56.00% in FY25, whereas return on capital employed increased to 53.14% from 40.00%.
Conclusion
Liotech's FY26 statements show that revenue, EBITDA, net profit and operating cash flow all increased from FY25, with revenue reaching Rs 70.09 crore and operating cash flow reaching Rs 6.48 crore. At the same time, fixed assets rose to Rs 12.58 crore and investment cash outflow widened to Rs 7.40 crore. The accompanying increase in inventories, receivables, payables and current borrowings indicates that the larger operating scale required more working-capital support.
Next, investors can watch whether Liotech's stated plan to raise funds to strengthen liquidity and increase order-taking appetite changes its working-capital position. Management also says it intends to enhance production and product quality, expand beyond its presence in nine states, upgrade manufacturing infrastructure and repay loans to improve the debt-to-equity ratio. H1 FY27 total income of Rs 33.92 crore, compared with Rs 36.25 crore in H1 FY26, is the next disclosed operating comparison against those plans.