










LiQTECH East India leads with 58.17% of H1 FY27 revenue
Key highlights
- East contributed Rs 19.57 crore, or 58.17%, of LiQTECH’s H1 FY27 revenue.
- West contributed Rs 13.90 crore, or 41.32%, of LiQTECH’s H1 FY27 revenue.
- East revenue increased from Rs 8.21 crore in FY24 to Rs 34.43 crore in FY26.
- LiQTECH’s H1 FY27 revenue was Rs 33.64 crore, versus Rs 36.11 crore in H1 FY26.
powered by IRIS
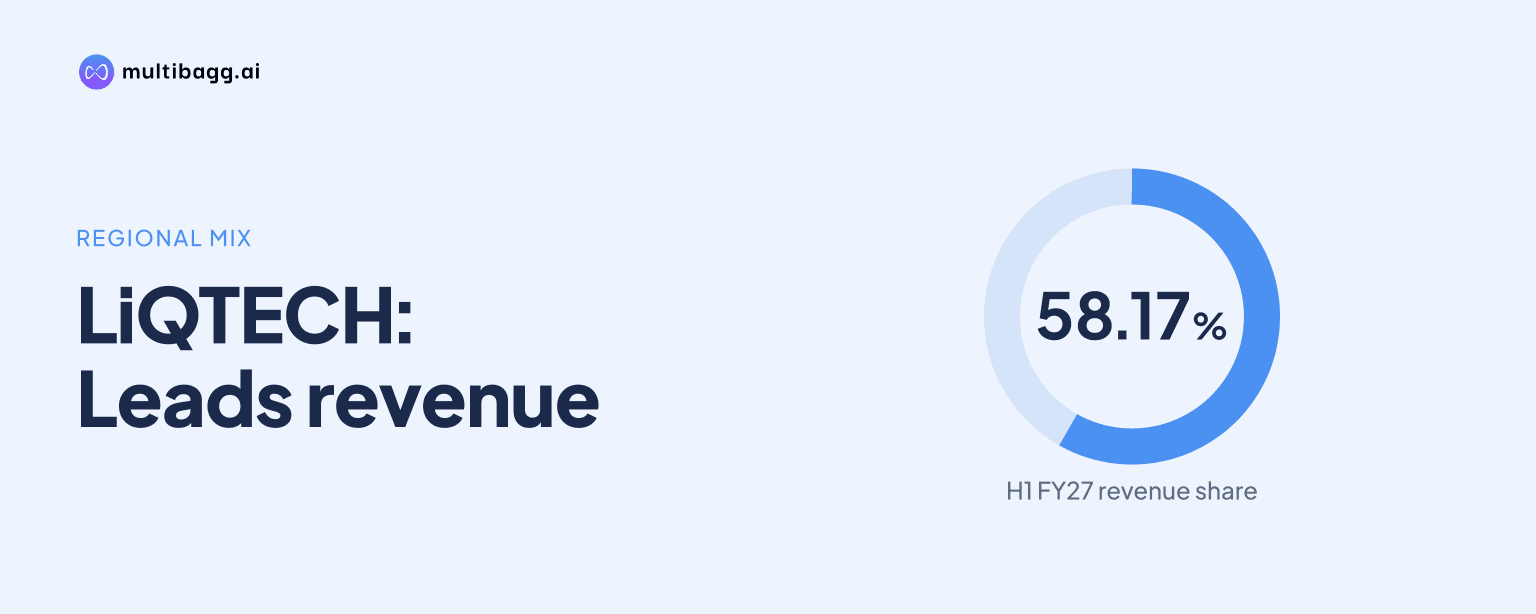
LiQTECH’s East region became its largest market in H1 FY27, generating Rs 19.57 crore or 58.17% of revenue, ahead of West at Rs 13.90 crore or 41.32%. The result reverses FY24, when West contributed 68.77% of revenue and East accounted for 29.48%.
Know Liotech Industries inside out
Results, valuation, peers and who's buying, in one view.
How did LiQTECH’s regional revenue mix change?
LiQTECH’s revenue mix changed from West-led in FY24 to East-led in H1 FY27. East’s share rose from 29.48% in FY24 to 46.64% in FY25, 49.12% in FY26 and 58.17% in H1 FY27, while West’s share declined from 68.77% to 51.74%, 50.55% and 41.32%, respectively.
The regional table reports no South revenue in FY24, FY25, FY26 or H1 FY27. North’s contribution reduced from Rs 0.49 crore, or 1.75%, in FY24 to Rs 0.17 crore, or 0.51%, in H1 FY27, leaving East and West as the company’s two reported revenue-generating regions.
What put East ahead of West in H1 FY27?
East led LiQTECH in H1 FY27 because its Rs 19.57 crore regional revenue exceeded West’s Rs 13.90 crore by Rs 5.67 crore. Management described East as the largest market, followed by West, while North represented 0.51% of revenue in the six-month period.
The comparison with FY24 shows the scale of the change. West generated Rs 19.16 crore in FY24, more than twice East’s Rs 8.21 crore; by FY26, the two regions were nearly equal at Rs 35.43 crore for West and Rs 34.43 crore for East.
The presentation does not identify the eastern states, customers or product categories behind East’s rise. It says growth across regions reflected stronger market penetration, while management said it was expanding the hardware manufacturing business to cater to diverse customer requirements and strengthen operating capabilities.
Got a follow-up? Ask IRIS
How does the regional change compare with LiQTECH’s overall revenue trend?
LiQTECH’s H1 FY27 revenue fell to Rs 33.64 crore from Rs 36.11 crore in H1 FY26, even as East increased its share to 58.17%. Total income, including Rs 0.28 crore of other income, was Rs 33.92 crore, down 6.42% from Rs 36.25 crore in the preceding first half.
Across completed years, revenue increased from Rs 27.86 crore in FY24 to Rs 40.68 crore in FY25 and Rs 70.09 crore in FY26. East revenue grew from Rs 8.21 crore in FY24 to Rs 34.43 crore in FY26, while West revenue rose from Rs 19.16 crore to Rs 35.43 crore over the same period.
Earnings before interest, tax, depreciation and amortisation, or EBITDA, were Rs 6.21 crore in H1 FY27, compared with Rs 5.70 crore in H1 FY26. Net profit was Rs 3.54 crore versus Rs 3.71 crore, while net profit margin increased to 10.51% from 10.29%.
What does LiQTECH disclose about customers and expansion plans?
LiQTECH reported lower stated revenue concentration among its largest customers in H1 FY27 while planning to broaden customer reach and enhance production capabilities. Its top customer was listed at Rs 6.21 crore and 9.58%, versus Rs 10.13 crore and 14.45% in FY26.
The top five customers contributed Rs 25.22 crore, or 38.90%, in H1 FY27, compared with Rs 49.48 crore and 70.59% in FY26. LiQTECH also reported Rs 33.41 crore from its top 10 customers and described its position as strong repeat business with a gradual reduction in reliance on single clients.
The reported H1 FY27 customer percentages do not directly reconcile with the Rs 33.64 crore regional revenue total, and LiQTECH does not state whether the customer table uses another revenue base. Management plans to explore opportunities across product segments; its Shapar, Rajkot facility has 12,632 square feet of area and installed capacity of 2,458.56 metric tonnes per annum.
Conclusion
LiQTECH’s H1 FY27 figures show a material geographic reversal. East moved from a 29.48% revenue share in FY24 to 58.17% in H1 FY27, while West moved from 68.77% to 41.32%. The new mix emerged during a first half in which total revenue declined by Rs 2.47 crore year on year.
The next results will indicate whether East retains its lead as management broadens customer reach and enhances production capabilities. Investors can also watch for clarification on the customer-contribution percentages, South-region reporting and the difference between management’s Rs 5.93 crore EBITDA comment and the Rs 6.21 crore EBITDA reported in the financial tables.