










Mangalam Brands’ Q2 revenue rose 51% but margin fell to 9.5%
Key highlights
- Mangalam Brands reported Q2 FY27 total income of Rs 82.69 crore, up 50.56% year on year.
- Mangalam Brands’ Q2 FY27 EBITDA from operations was Rs 7.86 crore, down 8.28% from Rs 8.57 crore.
- Operating EBITDA margin fell to 9.50% in Q2 FY27 from 15.60% in Q2 FY26.
- The Khopoli facility has annual capacity of 2,500 to 3,000 metric tonnes of camphor-based FMCG products.
powered by IRIS
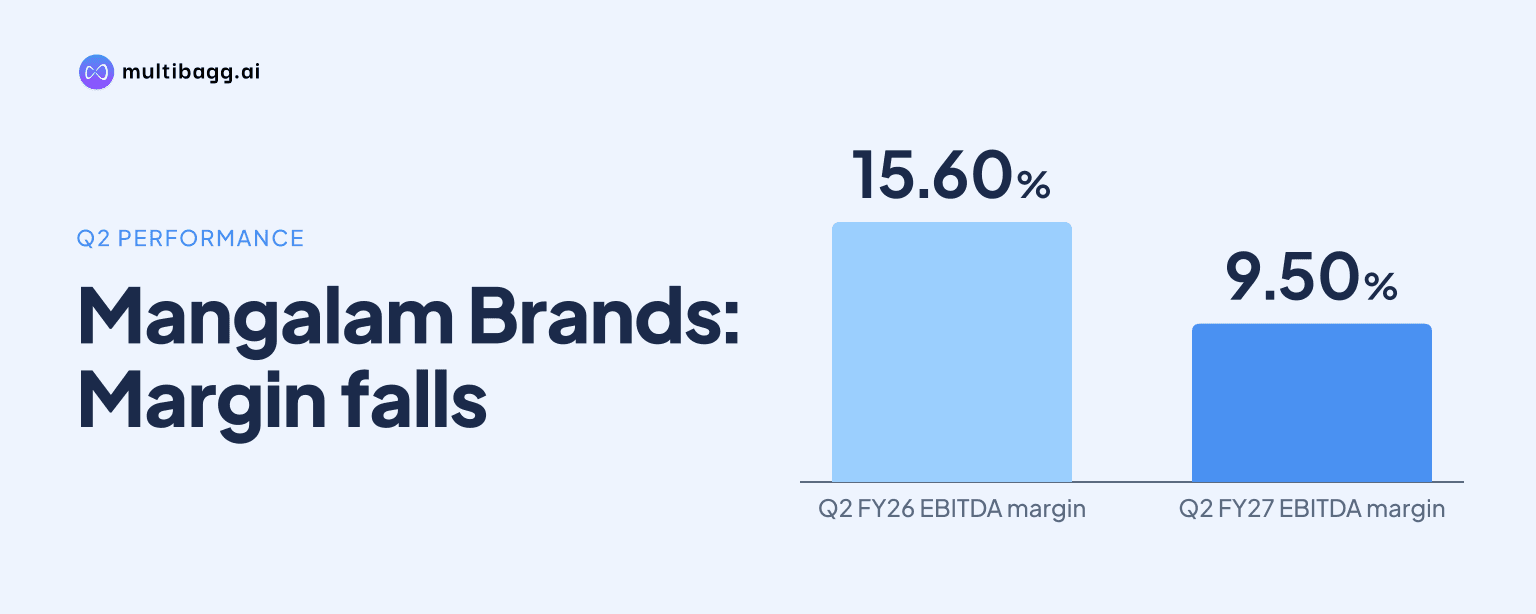
Mangalam Brands Private Limited reported Q2 FY27 total income of Rs 82.69 crore, up 50.56% from Q2 FY26, while EBITDA from operations fell 8.28% to Rs 7.86 crore and operating EBITDA margin declined to 9.50% from 15.60%. Revenue increased by Rs 27.77 crore even as operating EBITDA decreased by Rs 71 lakh.
Know Mangalam Organics inside out
Results, valuation, peers and who's buying, in one view.
What were Mangalam Brands’ Q2 FY27 income and operating EBITDA?
Mangalam Brands recorded total income of Rs 82.69 crore in Q2 FY27, compared with Rs 54.92 crore in Q2 FY26. The Rs 27.77 crore increase represents year-on-year growth of 50.56%, according to the subsidiary-performance figures presented by Mangalam Organics Limited.
Mangalam Brands’ EBITDA from operations was Rs 7.86 crore in Q2 FY27, against Rs 8.57 crore a year earlier. EBITDA, or earnings before interest, tax, depreciation and amortisation, declined by Rs 71 lakh despite the increase in total income, resulting in the reported 8.28% year-on-year decrease.
The quarterly comparison shows that Mangalam Brands generated higher income but lower operating EBITDA. The presentation does not disclose the cost categories, pricing movements, product mix, trade spending or promotional expense that led to this divergence between revenue and operating profit.
How far did Mangalam Brands’ operating margin decline?
Mangalam Brands’ EBITDA margin from operations fell by 6.10 percentage points to 9.50% in Q2 FY27 from 15.60% in Q2 FY26. The movement means the reported operating EBITDA margin was lower even though income expanded by more than half over the same quarterly comparison.
The decline in margin accompanied a Rs 27.77 crore increase in income and a Rs 71 lakh reduction in EBITDA from operations. The presentation identifies the percentage-point change but does not attribute it to raw-material costs, manufacturing expenses, distribution costs, advertising, discounts or any other specific operating factor.
Mangalam Organics reported a consolidated EBITDA margin of 14.11% in FY26, compared with 11.05% in FY25. That full-year group measure is not directly comparable with Mangalam Brands’ Q2 FY27 operating margin, but the subsidiary’s reported 9.50% quarterly figure was below the parent’s FY26 consolidated margin.
At the consolidated level, Mangalam Organics reported FY26 revenue of Rs 622.57 crore and EBITDA of Rs 87.82 crore, compared with Rs 530.01 crore and Rs 58.59 crore in FY25. The group’s year-on-year growth in both measures contrasts with Mangalam Brands’ Q2 result, where total income rose while operating EBITDA declined; no subsidiary-to-consolidated earnings reconciliation was disclosed.
Got a follow-up? Ask IRIS
Which Mangalam Brands products were featured during the year?
Mangalam Brands’ presentation featured camphor-led consumer products for worship, home fragrance and everyday spaces. Products under the Mangalam brand included the 3-in-1 Bhimsen Camphor pack with Original, Sandalwood and Lavender variants, Kapoor Dani, Aroma Tri Box, lavender camphor and Bhimsen Camphor Puja Oil.
A Mangalam Aroma Tri Box promotion stated that 25,000 people had ordered the product in the preceding 30 days. This is a product-level promotional claim in the presentation, rather than a disclosure of company-wide orders, total units sold or revenue generated by the product.
CampPure was shown in formats including Classic Cones, small pouches, tiles and stick-or-hang products. One displayed CampPure product claimed 45 days of freshness, while a social-media item stated that another product lasted up to 75 days; the presentation does not provide sales or profitability by format.
The material also described a CamPure Tile as containing 90% organic camphor and a separate CampPure product as 100% organic camphor with no DEET or naphthalene. It said CampPure products were handcrafted by over 300 women, but did not disclose their output, earnings contribution or share of Mangalam Brands’ Rs 82.69 crore Q2 FY27 income.
What manufacturing capacity supports Mangalam Brands’ products?
Mangalam Brands uses Mangalam Organics’ Khopoli, Maharashtra facility, which has annual capacity of 2,500 to 3,000 metric tonnes of camphor-based fast-moving consumer goods. The presentation says the facility supports products spanning spirituality, home fragrance, personal spaces and everyday care.
The 2,500-to-3,000-metric-tonne range is a production-capacity disclosure rather than a Q2 FY27 sales-volume measure. Mangalam Brands did not disclose capacity utilisation, production volume, inventory movement or the quantity supplied under the Mangalam and CampPure brands during the quarter.
Mangalam Organics describes its wider business as manufacturing pine-based specialty chemicals, including terpenes, synthetic resins and camphor. It says the launch of Mangalam Camphor Tablets in 2013 marked a step toward bringing its camphor expertise to Indian households, while the current consumer range extends into home-fragrance and worship formats.
Brand visibility activity included outdoor, social-media and television campaigns for Mangalam Bhimseni Camphor, alongside social-media and television-commercial material for CampPure. One Mangalam social-media placement promoted availability on Blinkit, but the presentation provides no marketing-spend amount, campaign-reach metric or return-on-advertising measure.
Conclusion
Mangalam Brands’ Q2 FY27 performance combined rapid income growth with lower operating profitability: total income rose 50.56% to Rs 82.69 crore, while EBITDA from operations declined 8.28% to Rs 7.86 crore. The resulting operating margin fell 6.10 percentage points to 9.50%, making the margin change more significant than the sales increase in the reported quarterly comparison.
The next results will show whether the Khopoli facility’s annual 2,500-to-3,000-metric-tonne FMCG capacity, expanding product formats and visibility campaigns translate into improved operating outcomes. The presentation gives no margin target, capacity-utilisation level, cost-management plan or explanation for the Q2 FY27 margin decline, leaving these matters unresolved.