










Marksans Pharma H1FY27 EBITDA rises 74.7% as margin hits 24%
Key highlights
- Marksans Pharma reported H1FY27 EBITDA of Rs 427.3 crore, up 74.7% year on year.
- H1FY27 EBITDA margin increased 574 basis points to 24.0% from 18.2%.
- H1FY27 operating cash flow was Rs 322 crore, and EBITDA-to-cash conversion reached 75% versus 31% a year earlier.
- UK and Europe contributed Rs 312 crore, or 71%, of the H1FY27 revenue increase.
powered by IRIS
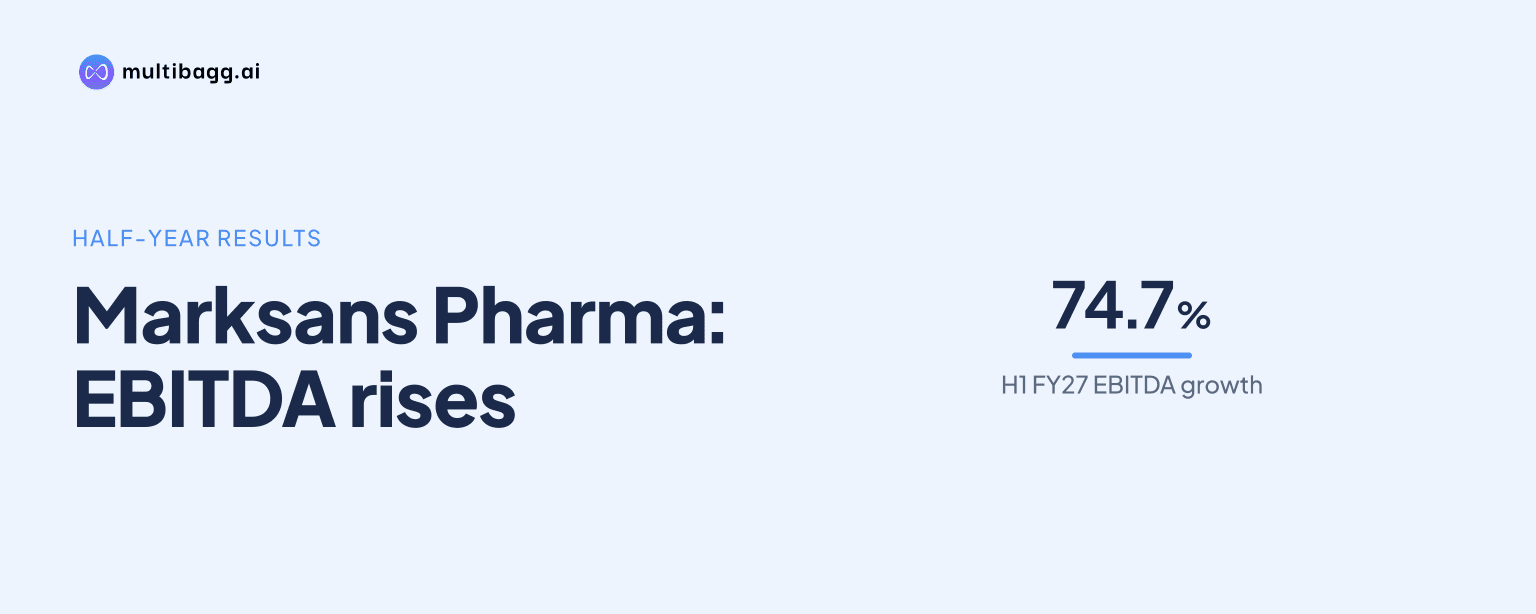
Marksans Pharma Limited reported earnings before interest, tax, depreciation and amortisation (EBITDA) of Rs 427.3 crore in H1FY27, up 74.7% year on year, as its EBITDA margin increased 574 basis points to 24.0% from 18.2%. Revenue rose 32.9% to Rs 1,781.0 crore, while gross-margin gains and operating leverage drove faster profit growth.
Know Marksans Pharma inside out
Results, valuation, peers and who's buying, in one view.
What drove Marksans Pharma’s H1FY27 EBITDA margin expansion?
Marksans Pharma’s EBITDA margin expanded because gross margin increased by 137 basis points and costs below gross profit rose more slowly than revenue. Gross profit increased 36.0% to Rs 1,047.4 crore in H1FY27, compared with revenue growth of 32.9% to Rs 1,781.0 crore. Gross margin reached 58.8%, up from 57.4% in H1FY26.
Management attributed the gross-margin increase to lower-cost inventory consumed during the period, particularly in Q1FY27, as well as favourable currency gains and product mix. It said operating leverage supplied the remaining 437 basis points of EBITDA-margin expansion, as costs below gross profit grew 18.0% against the 32.9% increase in revenue. EBITDA rose by Rs 182.7 crore from Rs 244.6 crore in H1FY26.
How did Marksans Pharma’s profit growth compare with revenue growth?
Marksans Pharma’s net profit grew 92.5% to Rs 302.9 crore in H1FY27, exceeding revenue growth of 32.9% and EBITDA growth of 74.7%. Net profit, also called profit after tax (PAT), rose by Rs 145.6 crore from Rs 157.3 crore in H1FY26. Net margin increased to 16.6% from 11.5%, based on net profit divided by total income.
The presentation attributes the PAT increase to EBITDA growth and higher other income. Management said H1FY27 PAT was already more than 70% of Marksans Pharma’s full-year FY26 profit. This result followed gross profit growing faster than sales and costs below gross profit increasing at 18.0%, below the 32.9% growth in revenue.
What does the Q2FY27 comparison show about margins?
Marksans Pharma’s Q2FY27 EBITDA margin moderated sequentially to 22.8% from 25.3% in Q1FY27, while remaining above the 20.1% reported in Q2FY26. Q2FY27 EBITDA was Rs 214.3 crore, nearly unchanged from Rs 213.0 crore in Q1FY27, despite revenue rising 11.8% sequentially to Rs 940.2 crore.
Management said Q2FY27 gross margin was 58.5%, below Q1FY27’s 59.1%, because Q1 had relatively lower material costs. Other expenses also rose by about Rs 20 crore sequentially, mainly due to freight costs. Q2FY27 PAT declined 10.0% to Rs 143.5 crore from Rs 159.4 crore, with management citing higher depreciation and amortisation on acquired intangibles, lower other income from currency movements and a 25.8% effective tax rate.
Got a follow-up? Ask IRIS
Which markets contributed most to Marksans Pharma’s H1FY27 growth?
Marksans Pharma’s UK and Europe business contributed Rs 312 crore, or 71%, of the Rs 440.6 crore increase in H1FY27 revenue. The region generated Rs 761 crore of revenue, up 69.4% year on year, while US and North America revenue was Rs 798 crore, up 11.7%. Australia and New Zealand generated Rs 188 crore, increasing 59.0%.
Management said new UK launches and about Rs 84 crore of H1FY27 revenue from QlinIQ, its European front-end, supported UK and Europe growth. Excluding QlinIQ, management put Marksans Pharma’s organic revenue growth at about 27% year on year. The presentation also records the completion of the ABCnow GmbH acquisition and research and development spending of Rs 47.1 crore, equal to 2.6% of H1FY27 revenue.
US and North America remained Marksans Pharma’s largest market at about 45% of H1FY27 revenue. Q2FY27 regional revenue reached Rs 420.9 crore, up 8.7% year on year and 11.6% sequentially. Marksans Pharma said the region manufactured and distributed more than 100 products, launched 112 stock-keeping units in FY26 and had 51 products in its pipeline.
How much cash did Marksans Pharma generate in H1FY27?
Marksans Pharma generated operating cash flow of Rs 322 crore in H1FY27, 4.3 times the H1FY26 level, and converted 75% of EBITDA into cash, compared with 31% a year earlier. Free cash flow was Rs 275 crore after capital expenditure of Rs 46 crore. The improvement in cash conversion accompanied EBITDA of Rs 427.3 crore.
The working-capital cycle improved to about 128 days in H1FY27 from about 138 days in FY26. Cash balances closed at Rs 1,124 crore and net cash was Rs 1,095 crore. Net cash increased by Rs 135 crore despite Rs 95 crore of merger-and-acquisition spending and Rs 41 crore of dividend payments.
Marksans Pharma also reported higher trailing-12-month return measures for the period to 30 September. Return on capital employed was 24.7%, compared with 18.7% a year earlier, and return on equity was 18.6%, compared with 13.6%. The presentation defines return on capital employed using earnings before interest and tax divided by capital employed, and return on equity using PAT divided by average opening and closing equity.
Conclusion
Marksans Pharma’s H1FY27 performance combined 32.9% revenue growth with faster gains in gross profit, EBITDA and PAT. UK and Europe provided most of the absolute revenue increase, including about Rs 84 crore from QlinIQ, while lower-cost inventory, currency gains, product mix and operating leverage supported the reported 24.0% EBITDA margin. Operating cash flow of Rs 322 crore also lifted EBITDA-to-cash conversion to 75% from 31%.
The next disclosed measure to watch is whether Marksans Pharma maintains margins relative to management’s FY27 EBITDA-margin guidance of 20% to 21%, after Q2FY27 margin eased to 22.8% from 25.3% in Q1FY27. Management’s plan is to sustain profitable organic growth while selectively pursuing acquisitions that expand capabilities and market presence, alongside development of its European front-end and the US pipeline of 51 products.