










Merritronix FY26 cash outflow reached Rs 23.38 crore
Key highlights
- Merritronix reported negative operating cash flow of Rs 23.38 crore in FY26, compared with negative Rs 6.64 crore in FY25.
- FY26 inventories were Rs 71.31 crore and trade receivables were Rs 36.55 crore, together up Rs 47.81 crore year on year.
- Merritronix reported FY26 PAT of Rs 16.10 crore, compared with Rs 8.66 crore in FY25.
- Financing activities generated Rs 41.15 crore in FY26, while short-term borrowings reached Rs 37.90 crore.
powered by IRIS
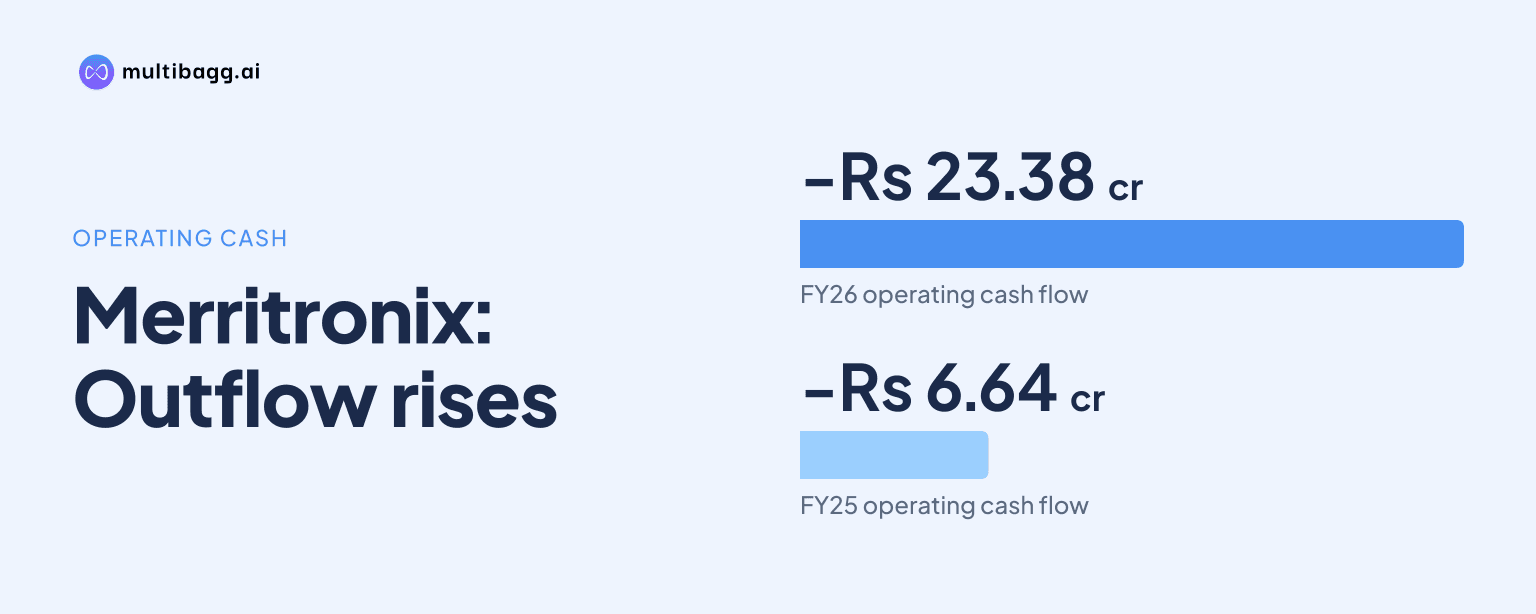
Merritronix Limited reported negative cash flow from operating activities of Rs 23.38 crore in FY26 despite profit after tax of Rs 16.10 crore, as year-end inventories and trade receivables reached a combined Rs 107.86 crore. Merritronix had reported a Rs 6.64 crore operating cash outflow in FY25 and a Rs 4.53 crore inflow in FY24.
Know Merritronix inside out
Results, valuation, peers and who's buying, in one view.
Why did Merritronix report negative operating cash flow in FY26?
Merritronix reported an operating cash outflow of Rs 23.38 crore in FY26, which was larger than the Rs 6.64 crore outflow in FY25 and contrasted with a Rs 4.53 crore inflow in FY24. The presentation does not give a line-by-line reconciliation between profit and operating cash flow, but its balance sheet records substantial increases in inventory, receivables and short-term loans and advances during FY26.
Inventories increased by Rs 31.62 crore year on year to Rs 71.31 crore, while trade receivables increased by Rs 16.19 crore to Rs 36.55 crore. Short-term loans and advances also rose by Rs 7.22 crore to Rs 14.81 crore. These three current-asset balances increased by Rs 55.03 crore in aggregate, while revenue from operations increased by Rs 42.33 crore in FY26.
Trade payables rose to Rs 24.27 crore in FY26 from Rs 14.65 crore in FY25, providing a partial offset to the higher current assets. However, payables remained below the Rs 39.29 crore reported in FY24. Total current assets more than doubled to Rs 148.43 crore from Rs 70.10 crore, while total current liabilities rose to Rs 95.31 crore from Rs 51.85 crore.
How did Merritronix increase profit while cash flow declined?
Merritronix increased revenue from operations to Rs 155.90 crore in FY26 from Rs 113.56 crore in FY25 and Rs 85.70 crore in FY24. Profit after tax, or PAT, rose to Rs 16.10 crore from Rs 8.66 crore in FY25 and Rs 3.05 crore in FY24. The reported earnings trend therefore differed from operating cash flow, which was negative for the second consecutive year.
Raw-material costs rose to Rs 122.58 crore in FY26 from Rs 92.68 crore in FY25, broadly tracking the higher scale of operations. Employee-benefit expense rose to Rs 2.34 crore from Rs 1.71 crore, while other expenses declined to Rs 3.75 crore from Rs 4.04 crore. The detailed profit and loss statement reports earnings before interest, tax, depreciation and amortisation, or EBITDA, of Rs 27.57 crore, compared with Rs 15.62 crore in FY25.
The financial-highlights page reports a separate FY26 EBITDA figure of Rs 27.22 crore and an EBITDA margin of 17.42%, versus 13.31% in FY25. Its PAT margin was 10.33% in FY26, compared with 7.63% in FY25 and 3.56% in FY24. The Rs 0.35 crore difference between the FY26 EBITDA on the highlights page and the detailed statement is disclosed within the presentation itself.
Finance costs increased to Rs 4.08 crore in FY26 from Rs 2.83 crore in FY25, while depreciation and amortisation increased to Rs 0.47 crore from Rs 0.39 crore. Merritronix says it invested in new-generation surface-mount technology, or SMT, equipment during FY25-26, including a Panasonic NPM D3A pick-and-place line commissioned in January 2026. Fixed assets rose to Rs 5.92 crore at FY26 end from Rs 3.74 crore a year earlier.
Got a follow-up? Ask IRIS
How was Merritronix’s FY26 cash balance funded?
Merritronix recorded financing cash inflow of Rs 41.15 crore in FY26, compared with Rs 0.74 crore in FY25 and Rs 0.27 crore in FY24. This inflow exceeded the Rs 23.38 crore operating outflow and the Rs 2.59 crore investing outflow, resulting in a Rs 15.18 crore net increase in cash and cash equivalents during FY26.
Cash and bank balances rose to Rs 25.70 crore at FY26 end from Rs 2.42 crore at FY25 end. The presentation does not identify the individual sources of the Rs 41.15 crore financing inflow, so it does not establish the respective contribution from borrowings, equity issuance or other financing transactions.
Short-term borrowings increased to Rs 37.90 crore in FY26 from Rs 13.76 crore in FY25 and Rs 9.91 crore in FY24. Long-term borrowings rose to Rs 5.30 crore from Rs 4.81 crore in FY25, although they remained below the Rs 5.90 crore reported in FY24. The rise in short-term borrowing occurred alongside the larger inventory and receivables balances.
Share capital increased to Rs 12.78 crore from Rs 1.45 crore, while reserves and surplus increased to Rs 40.34 crore from Rs 15.39 crore. Net worth consequently rose to Rs 53.13 crore from Rs 16.84 crore. Merritronix reported a debt-to-equity ratio of 0.81 times in FY26, down from 1.10 times in FY25, and a current ratio of 1.56 times, up from 1.35 times.
What do Merritronix’s working-capital balances show?
Merritronix ended FY26 with inventories of Rs 71.31 crore and trade receivables of Rs 36.55 crore, compared with Rs 39.69 crore and Rs 20.36 crore respectively at the end of FY25. Their combined balance of Rs 107.86 crore was Rs 47.81 crore higher year on year, exceeding the Rs 42.33 crore increase in annual revenue from operations.
The FY26 inventory balance was more than twice the Rs 33.50 crore recorded in FY24, while receivables were more than three times the Rs 11.19 crore FY24 balance. The presentation describes operational discipline across procurement, inventory and production planning as a strategic growth lever, but it does not disclose inventory turns, receivable days, customer payment terms or an expected timing for cash conversion.
Other current liabilities rose to Rs 26.28 crore in FY26 from Rs 19.74 crore in FY25, and short-term provisions rose to Rs 6.85 crore from Rs 3.71 crore. These liabilities contributed to the increase in total current liabilities, but the presentation does not specify their settlement timing. The disclosed current ratio increased despite the larger liability base because current assets grew more quickly.
Merritronix also reported return on equity of 46.03% and return on capital employed of 45.26% in FY26, compared with 69.21% and 66.21% respectively in FY25. Net asset value per share, stated after the bonus and subdivision of shares, increased to Rs 41.56 from Rs 15.46. These ratio changes accompanied a balance-sheet expansion to total assets of Rs 154.40 crore from Rs 74.18 crore.
Conclusion
Merritronix’s FY26 presentation shows rising revenue and PAT alongside a widening gap between reported earnings and cash generated from operations. Higher inventory, receivables and short-term loans and advances were recorded at the same time as financing inflows and short-term borrowings increased, leaving the company with a larger year-end cash balance but negative operating cash flow.
What to watch next is whether inventory of Rs 71.31 crore and receivables of Rs 36.55 crore convert into operating cash, and how short-term borrowings of Rs 37.90 crore develop. Management’s disclosed plan includes further SMT, testing and inspection investment, direct engagement with defence public-sector undertakings, selective adjacent-platform expansion, strategic partnerships and entry into regulated international markets.