










Midwest H1 cash flow turns negative as cycle reaches 127 days
Key highlights
- Midwest reported negative Rs 6.73 crore cash flow from operations in H1FY27, after Rs 174.72 crore in FY26.
- Midwest's working-capital cycle increased by 23 days from FY26 to 127 days in H1FY27.
- H1FY27 PAT was Rs 61.29 crore and EBITDA was Rs 96.51 crore.
- Management's three-to-four-year vision includes Rs 300 crore of capital expenditure and a 35% ROCE target.
powered by IRIS
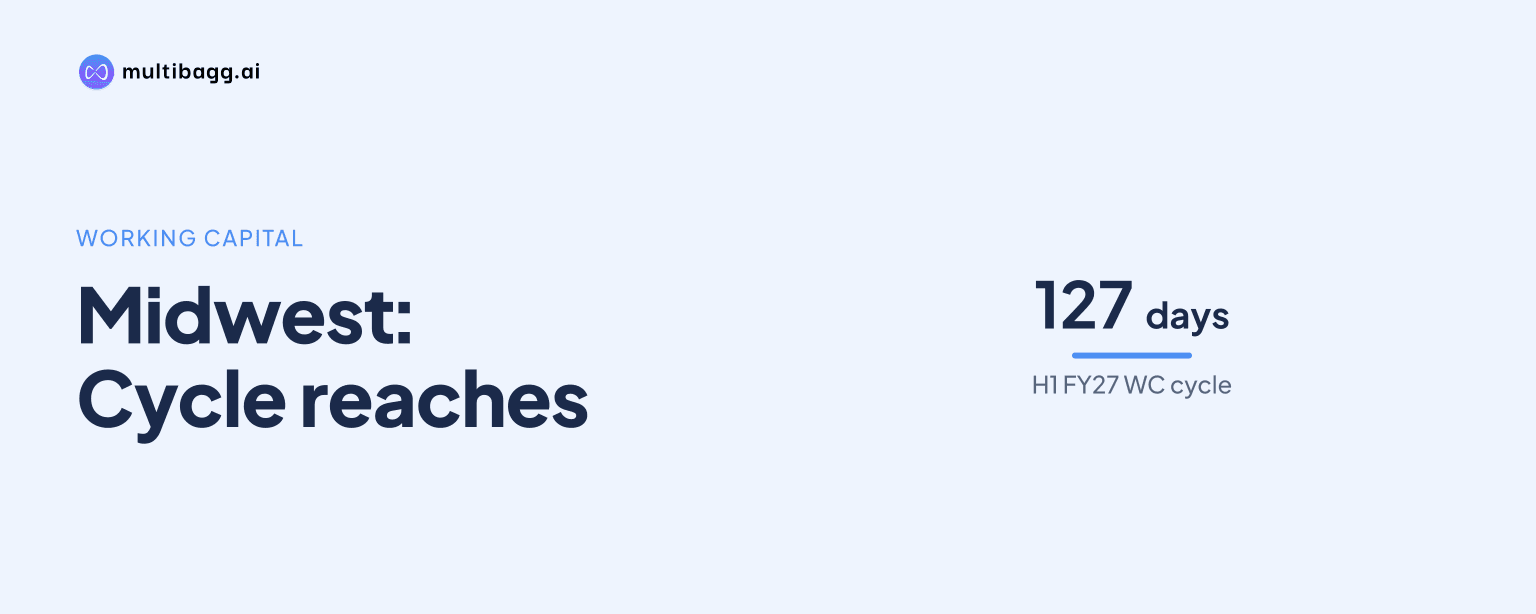
Midwest Limited reported negative operating cash flow of Rs 6.73 crore in H1FY27 as its working-capital cycle reached 127 days, up from 104 days in FY26. The cash result contrasts with H1FY27 revenue of Rs 374.38 crore, earnings before interest, tax, depreciation and amortisation (EBITDA) of Rs 96.51 crore, and profit after tax (PAT) of Rs 61.29 crore.
Know Midwest inside out
Results, valuation, peers and who's buying, in one view.
What happened to Midwest operating cash flow in H1FY27?
Midwest's cash flow from operations was negative Rs 6.73 crore in H1FY27, reversing from positive cash flow of Rs 174.72 crore in FY26. The presentation gives annual figures from FY23 through FY26 and a first-half figure for H1FY27, so it does not provide a directly comparable H1FY26 cash-flow number or a stated cause for the reversal.
The H1FY27 outcome followed an increase in annual operating cash flow from Rs 87.31 crore in FY25 to Rs 174.72 crore in FY26, a change of Rs 87.41 crore. It also differs from FY23, when Midwest reported negative operating cash flow of Rs 51.946 crore, before reporting Rs 127.91 crore in FY24 and Rs 87.31 crore in FY25.
Why did Midwest profit not translate into positive operating cash flow?
Midwest recorded PAT of Rs 61.29 crore in H1FY27 despite the Rs 6.73 crore operating cash outflow. Its PAT margin was 16.37%, compared with 16.49% in FY26, showing that reported profit and cash flow from operations moved in different directions during the half year.
EBITDA was Rs 96.51 crore in H1FY27, producing a 25.78% margin on revenue of Rs 374.38 crore. This margin was below FY26's 27.01%, when Midwest reported EBITDA of Rs 174.37 crore on revenue of Rs 645.62 crore; however, the presentation does not disclose receivables, inventory, payables or a cash-flow bridge, so the components behind the H1FY27 cash outflow cannot be identified.
How much did Midwest's working-capital cycle lengthen?
Midwest's working-capital cycle reached 127 days in H1FY27, rising by 23 days from 104 days in FY26. This was the longest period in the FY23-to-H1FY27 series and coincided with the move from Rs 174.72 crore of positive operating cash flow in FY26 to a Rs 6.73 crore outflow in H1FY27.
The cycle had improved by 16 days between FY25, when it was 120 days, and FY26, when it was 104 days. Midwest says its FY23-to-FY26 financial growth was supported by a stringent credit policy and favourable customer payment terms, but it provides no equivalent explanation for the 127-day H1FY27 cycle.
Got a follow-up? Ask IRIS
What operating data provide context for Midwest's first-half cash position?
Midwest produced 40,073 cubic metres of Black Galaxy Granite in H1FY27 and sold 39,563 cubic metres, compared with FY26 production of 75,988 cubic metres and sales of 72,789 cubic metres. The H1FY27 figures cover six months rather than a full year, but they show continued activity in a core granite product while the working-capital cycle reached 127 days.
Absolute Black production was 20,397 cubic metres in H1FY27 and sales were 20,671 cubic metres, while diamond-wire production was 1,03,470 metres and sales were 87,969 metres. Midwest says granite blocks, particularly Absolute Black and Black Galaxy Granite, accounted for 96% of revenue over FY23 to FY26, while diamond wire and other secondary segments accounted for 2% each; it does not allocate H1FY27 working capital or cash flow by product.
What Midwest plans could affect cash conversion next?
Midwest's stated vision for the next three to four years includes Rs 300 crore of capital expenditure, a 35% return on capital employed (ROCE) target, and profitability growth of more than three times. These are management targets and plans rather than H1FY27 outcomes, and the presentation does not disclose annual timing, funding mix or the expected effect on the 127-day working-capital cycle.
Midwest also proposes solar generation of 0.66 megawatts at two mine locations and has inducted one electric tipper truck on a pilot basis. It says its electric squaring and dressing station, co-developed with an Italian company, can replace at least three mechanical drills, while its three-to-four-year plan includes a 15% to 20% reduction in energy consumption and new verticals in rare earth materials, heavy mineral sands and high-purity quartz.
Conclusion
Midwest's H1FY27 figures show a difference between reported earnings and operating cash generation: PAT of Rs 61.29 crore and EBITDA of Rs 96.51 crore were accompanied by a Rs 6.73 crore operating cash outflow. The working-capital cycle rose by 23 days from FY26 to 127 days during the same period, although the presentation does not identify the underlying receivable, inventory or payable movements.
The next disclosed benchmarks are management's three-to-four-year Rs 300 crore capital-expenditure plan, 35% ROCE target and more-than-three-times profitability-growth objective. What to watch next is whether subsequent disclosures show the working-capital cycle moving from 127 days, operating cash flow returning to positive territory, and progress on the proposed 0.66-megawatt solar capacity and electrification measures.