










NCL Industries H1 FY27 EBITDA falls 25% despite revenue growth
Key highlights
- NCL Industries’ H1 FY27 revenue rose 7.3% to Rs 729.5 crore.
- NCL Industries’ H1 FY27 EBITDA fell 25.0% to Rs 76.8 crore.
- NCL Industries’ EBITDA margin declined 453 basis points to 10.53% in H1 FY27.
- Cement EBITDA per MT fell by Rs 346 as net selling price declined by Rs 5 per bag.
powered by IRIS
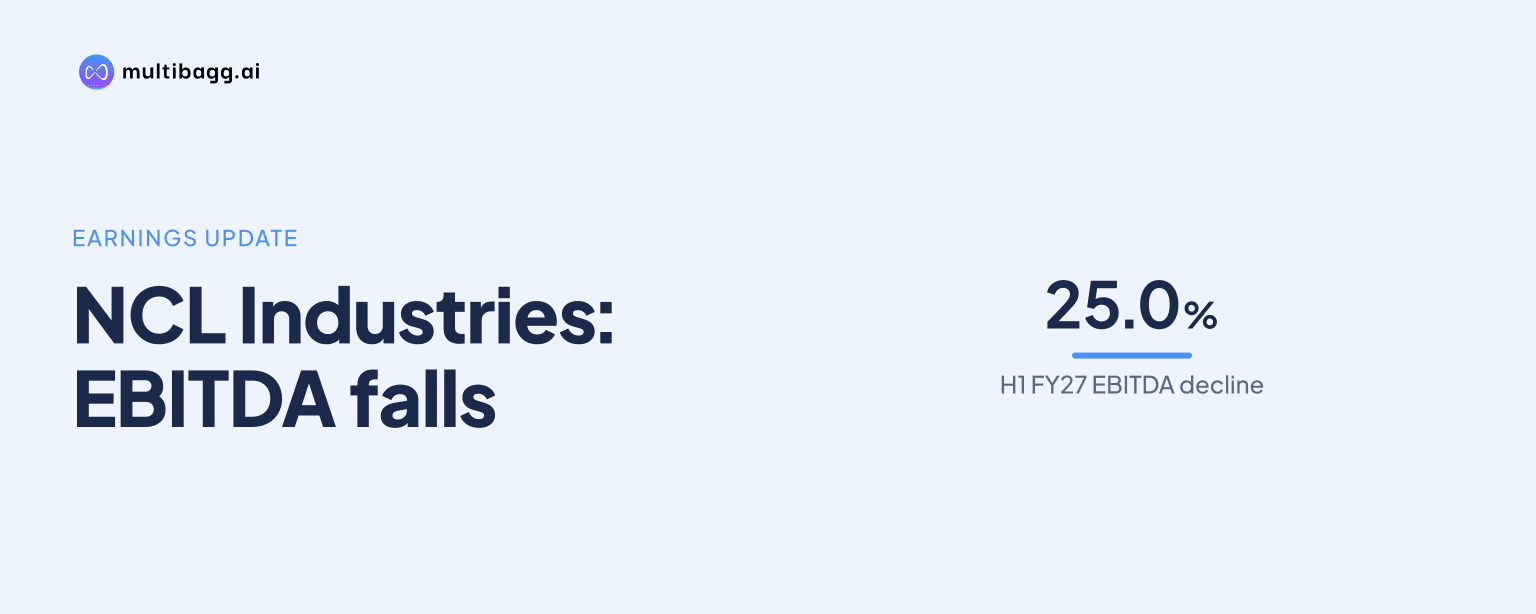
In H1 FY27, NCL Industries Limited reported earnings before interest, tax, depreciation and amortisation (EBITDA) of Rs 76.8 crore, down 25.0% year on year, while revenue from operations rose 7.3% to Rs 729.5 crore and EBITDA margin fell 453 basis points to 10.53%.
Know NCL Industries inside out
Results, valuation, peers and who's buying, in one view.
Why did NCL Industries’ H1 FY27 EBITDA margin decline?
NCL Industries’ EBITDA margin declined because operating expenses rose faster than revenue in H1 FY27. Operating expenses increased 13.0% to Rs 652.7 crore from Rs 577.5 crore in H1 FY26, exceeding the 7.3% revenue increase to Rs 729.5 crore from Rs 679.9 crore. EBITDA consequently fell by Rs 25.6 crore, from Rs 102.4 crore to Rs 76.8 crore, while margin moved to 10.53% from 15.06%.
The presentation identifies cement unit profitability as the principal operating issue. Cement EBITDA per metric tonne (MT) declined by Rs 346 versus H1 FY26, mainly because net selling price fell by Rs 5 per bag and power, fuel and packing-material costs increased. Below EBITDA, depreciation rose 16.0% to Rs 29.7 crore, finance cost increased 12.6% to Rs 10.7 crore, and other income declined 25.8% to Rs 8.9 crore, resulting in a 42.9% fall in profit before tax before exceptional items to Rs 45.3 crore.
How did cement volumes and prices affect NCL Industries?
NCL Industries sold an additional 1.96 lakh MT of cement in H1 FY27 compared with H1 FY26, but the higher volume did not offset the decline in cement price realisation and the increase in production-related inputs. The Rs 346 decline in cement EBITDA per MT connects the Rs 5-per-bag net selling-price reduction with higher power, fuel and packing-material costs during the half year.
The Q2 FY27 result showed a similar volume-and-margin pattern. Cement sales volume increased by 1.07 lakh MT against Q1 FY27, while cement EBITDA per MT fell by Rs 124, which the presentation attributes to a Rs 4-per-bag reduction in net selling price and higher power and fuel costs. Consolidated Q2 revenue rose 12.0% year on year to Rs 385.9 crore, but EBITDA fell 26.3% to Rs 37.2 crore and margin declined to 9.64% from 14.66% in Q2 FY26.
Which businesses partly offset NCL Industries’ cement pressure?
NCL Industries’ boards business partly offset the cement pressure in H1 FY27. The presentation says Boards EBITDA improved on higher sales volumes and savings in salaries and other overhead expenses, while Bison Panel volume increased by 1,571 MT from H1 FY26. This was a different earnings movement from cement, where higher sales volume was accompanied by lower EBITDA per MT.
Ready-mix concrete (RMC) and energy had mixed half-year trends. RMC sales volume declined by 25,292 cubic metres in H1 FY27 versus H1 FY26, and Energy EBITDA declined primarily because of lower power generation. In Q2 FY27, however, RMC volume increased by 4,880 cubic metres from Q1 FY27 and its EBITDA improved with volume, while Energy EBITDA also improved mainly because of power generation during that quarter.
Got a follow-up? Ask IRIS
How did profit and the balance sheet change in H1 FY27?
NCL Industries reported profit after tax of Rs 37.3 crore in H1 FY27, down 7.2% from Rs 40.2 crore a year earlier, a smaller decline than the 25.0% EBITDA reduction. Tax expense fell to Rs 12.9 crore from Rs 26.2 crore, while exceptional items changed to a negative Rs 4.9 crore from a positive Rs 9.7 crore in H1 FY26. Diluted earnings per share declined 7.0% to Rs 8.26 from Rs 8.88.
Total equity increased to Rs 968.5 crore at H1 FY27 from Rs 940.2 crore at FY26. Long-term borrowings declined to Rs 145.2 crore from Rs 149.3 crore, while short-term borrowings rose to Rs 109.3 crore from Rs 87.2 crore and trade receivables increased to Rs 152.2 crore from Rs 118.3 crore. Debt to equity was 0.26 times at H1 FY27, compared with 0.25 times at FY26 and 0.29 times at FY25.
How does H1 FY27 compare with NCL Industries’ recent profitability?
NCL Industries’ H1 FY27 EBITDA margin of 10.53% was below the 13.36% reported for FY26 and the 12.58% reported for FY24, though it remained above FY25’s 8.76%. EBITDA in H1 FY27 was Rs 76.8 crore, compared with Rs 190.0 crore for FY26, while the presentation reports only the first half rather than a full FY27 result.
The FY26 figures had improved from FY25, when revenue rose to Rs 1,422.1 crore from Rs 1,362.1 crore and EBITDA rose to Rs 190.0 crore from Rs 119.3 crore. The H1 FY27 margin decline therefore followed the FY26 recovery in profitability. Cash and bank balances were Rs 22.0 crore at H1 FY27 versus Rs 10.1 crore at FY26, while inventories declined to Rs 142.1 crore from Rs 148.1 crore.
Conclusion
NCL Industries’ H1 FY27 figures show that 7.3% revenue growth and a 1.96 lakh-MT increase in cement volume were insufficient to protect operating earnings. EBITDA fell 25.0% to Rs 76.8 crore because lower cement selling prices and higher power, fuel and packing-material costs reduced cement EBITDA per MT by Rs 346, taking group margin down to 10.53%.
What remains unresolved is whether the Rs 5-per-bag reduction in cement net selling price and the stated input-cost pressure persist after H1 FY27. The next set of operating trends can also be assessed against Q2, when RMC volume rose by 4,880 cubic metres and Energy EBITDA improved with power generation, even as cement EBITDA per MT declined by Rs 124 sequentially.