










NLC India H1 FY27 PAT rises 13% as PBT falls 26% year-on-year
Key highlights
- NLC India reported H1 FY27 PAT of Rs 1,764 crore, up 13% from Rs 1,564 crore.
- H1 FY27 PBT fell 26% to Rs 1,116 crore from Rs 1,515 crore.
- NLC India’s EBITDA margin declined to 35% in H1 FY27 from 40% in H1 FY26.
- Finance cost rose 39% to Rs 820 crore and depreciation increased 28% to Rs 1,394 crore.
powered by IRIS
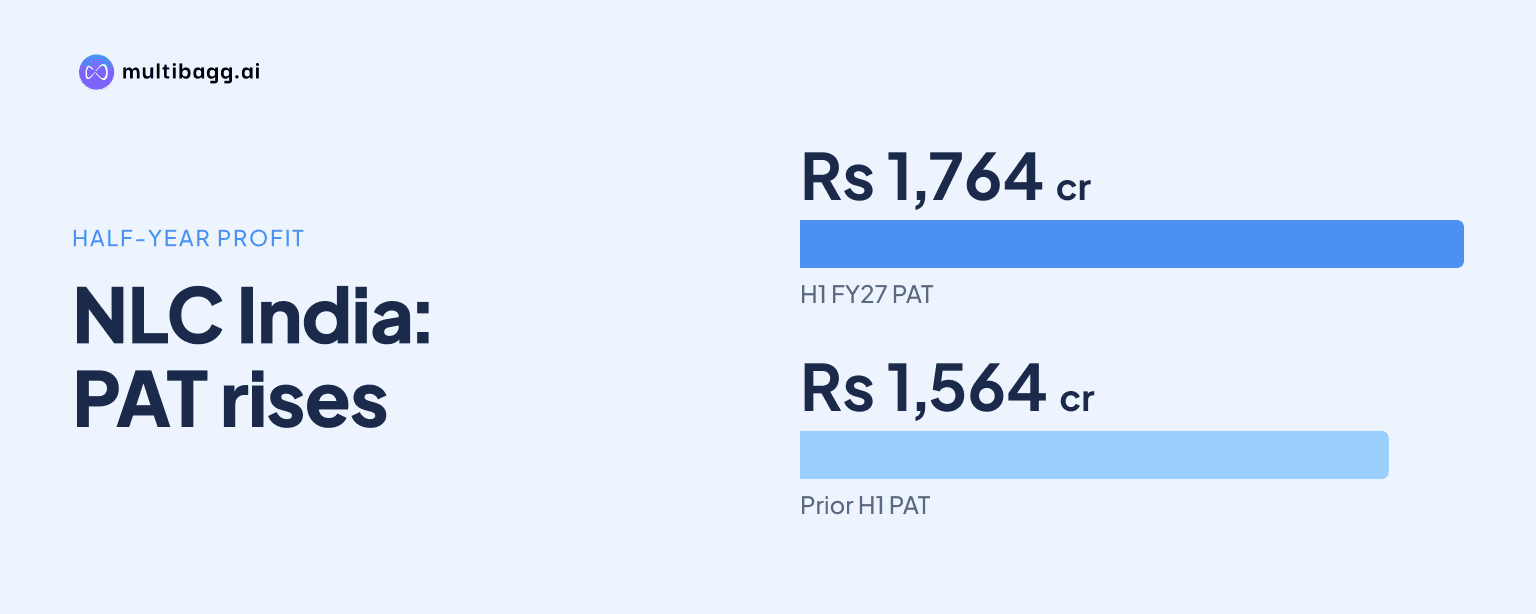
NLC India Limited (NLC India) reported H1 FY27 profit after tax of Rs 1,764 crore, up 13% year on year, although profit before tax fell 26% to Rs 1,116 crore as revenue growth was accompanied by higher costs, lower other income and a decline in net regulatory movement.
Know NLC India inside out
Results, valuation, peers and who's buying, in one view.
What drove NLC India’s H1 FY27 earnings divergence?
NLC India’s reported earnings divergence reflects a Rs 200 crore increase in profit after tax, or PAT, alongside a Rs 399 crore decline in profit before tax, or PBT. PAT rose to Rs 1,764 crore in H1 FY27 from Rs 1,564 crore in H1 FY26, while PBT declined to Rs 1,116 crore from Rs 1,515 crore. The presentation reports both measures but does not provide a tax expense, tax credit or reconciliation that explains the difference between their movements.
Revenue from operations increased by Rs 1,445 crore to Rs 9,449 crore, while total income rose by Rs 1,231 crore to Rs 9,694 crore. The difference reflects other income, which declined to Rs 245 crore in H1 FY27 from Rs 459 crore a year earlier. The presentation’s financial overview also shows tax declining 7%, but gives neither a tax amount nor an explanation for the PAT and PBT divergence.
Did NLC India convert higher revenue into operating profit?
NLC India increased earnings before interest, tax, depreciation and amortisation, or EBITDA, by Rs 140 crore to Rs 3,330 crore in H1 FY27 from Rs 3,190 crore in H1 FY26. Revenue grew by Rs 1,445 crore over the same period, so EBITDA expanded more slowly than revenue. The reported EBITDA margin consequently fell by 5 percentage points to 35% from 40%.
The H1 FY27 result compares with full-year FY26 revenue of Rs 17,490 crore and EBITDA of Rs 7,475 crore. H1 FY27 revenue of Rs 9,449 crore exceeded half of FY26 revenue, while H1 EBITDA of Rs 3,330 crore was below half of FY26 EBITDA. This comparison does not establish a full-year outcome because the presentation provides no second-half revenue or margin outlook.
NLC India separately reported operating profit margin, or OPM, of 17.44% in H1 FY27, compared with 22.39% in FY26. This ratio is not directly comparable with the 35% EBITDA margin because the presentation defines OPM as including net regulatory expenses or income while excluding exceptional items and other income. Net profit margin was 18.20% in H1 FY27, versus 20.49% in FY26, and earnings per share rose to Rs 13.45 from Rs 10.55 in H1 FY26.
Which costs and regulatory movements reduced NLC India’s PBT?
NLC India’s PBT declined as expenditure, depreciation and finance cost rose while other income and net regulatory movement fell. Expenditure increased 17%, or Rs 941 crore, to Rs 6,610 crore in H1 FY27. Depreciation and amortisation rose 28%, or Rs 307 crore, to Rs 1,394 crore, and finance cost increased 39%, or Rs 232 crore, to Rs 820 crore.
Other income fell 47% to Rs 245 crore from Rs 459 crore, a reduction of Rs 214 crore. Net regulatory movement income or expense decreased 38% to Rs 246 crore from Rs 397 crore, reducing the reported amount by Rs 151 crore. Together, the decline in other income and regulatory movement was Rs 365 crore, while the combined increase in expenditure, depreciation and finance cost was Rs 1,480 crore.
The presentation defines PBT as considering net movement in regulatory deferral income or expenses. On that basis, H1 FY27 PBT of Rs 1,116 crore was below the FY26 full-year PBT of Rs 3,875 crore and FY25 PBT of Rs 3,697 crore, though a six-month number is not comparable with a full financial year as if both covered the same period. The source does not identify individual projects, borrowing facilities or regulatory decisions behind these movements.
Got a follow-up? Ask IRIS
How did NLC India’s segment mix and balance sheet change?
NLC India reported H1 FY27 total income of Rs 9,694 crore, comprising Rs 7,678 crore from power, Rs 1,683 crore from mines and Rs 333 crore from other activities. Power was the largest reported income category. The mine income figure was below the Rs 2,882 crore reported for the full FY26 period, while power income was below FY26 power income of Rs 14,425 crore.
The presentation separately shows Rs 12,666 crore of total segment revenue, comprising Rs 7,571 crore in thermal revenue, Rs 4,632 crore in mining revenue and Rs 462 crore in renewables revenue. It states that this total excludes inter-segment revenue of Rs 3,217 crore. These segment figures use a different basis from the Rs 9,449 crore consolidated revenue from operations, so they should not be added to that consolidated measure.
Assets stood at Rs 67,385 crore in H1 FY27, including regulatory assets, while equity and reserves were Rs 27,053 crore and liabilities were Rs 40,332 crore. Net worth increased to Rs 23,401 crore from Rs 21,525 crore in FY26. The debt-to-equity ratio was 1.20 times, compared with 1.29 times in FY26 and the same 1.20 times in FY25.
Capital employed rose to Rs 53,968 crore in H1 FY27 from Rs 52,559 crore in FY26, while annualised return on capital employed, or ROCE, was 7.17% against 9.70% for FY26. Total net book value of assets increased to Rs 40,405 crore from Rs 36,372 crore, led by thermal assets rising to Rs 29,786 crore from Rs 25,965 crore. Renewable asset value was Rs 6,361 crore, compared with Rs 6,376 crore in FY26.
NLC India reported installed generation capacity of 6.6 gigawatts, or GW, in thermal generation and 1.8 GW in renewable generation. Thermal capacity represented 79% of the stated 8.4 GW portfolio, while renewable capacity represented 21%. This installed-capacity split differs from the H1 FY27 segment revenue disclosure, which assigned 60% to thermal, 36% to mines and 4% to renewables.
Conclusion
NLC India’s H1 FY27 results combined 18% growth in revenue from operations and 13% growth in PAT with a 26% fall in PBT and a 5-percentage-point decline in EBITDA margin. Higher expenditure, depreciation and finance costs, together with Rs 365 crore less other income and net regulatory movement, coincided with PBT falling to Rs 1,116 crore despite revenue reaching Rs 9,449 crore.
The next measure of progress will be NLC India’s execution of its disclosed plan to build 16 GW of renewable capacity by 2032, alongside its existing 6.6 GW thermal and 1.8 GW renewable portfolio. Investors can also watch whether finance cost of Rs 820 crore, net regulatory movement of Rs 246 crore and the 35% EBITDA margin change as capital employed, which reached Rs 53,968 crore, continues to rise.