










Osel Devices Limited H1 Growth Left Operating Cash Negative
Key highlights
- OSEL reported negative operating cash flow of Rs 7.65 crore in H1 FY27 despite profit after tax of Rs 18.08 crore.
- OSEL’s working-capital changes used Rs 43.35 crore in H1 FY27.
- OSEL’s short-term borrowings increased Rs 50.96 crore to Rs 145.33 crore at 30 September 2026.
- OSEL used Rs 47.97 crore in investing activities and generated Rs 55.05 crore from financing activities in H1 FY27.
powered by IRIS
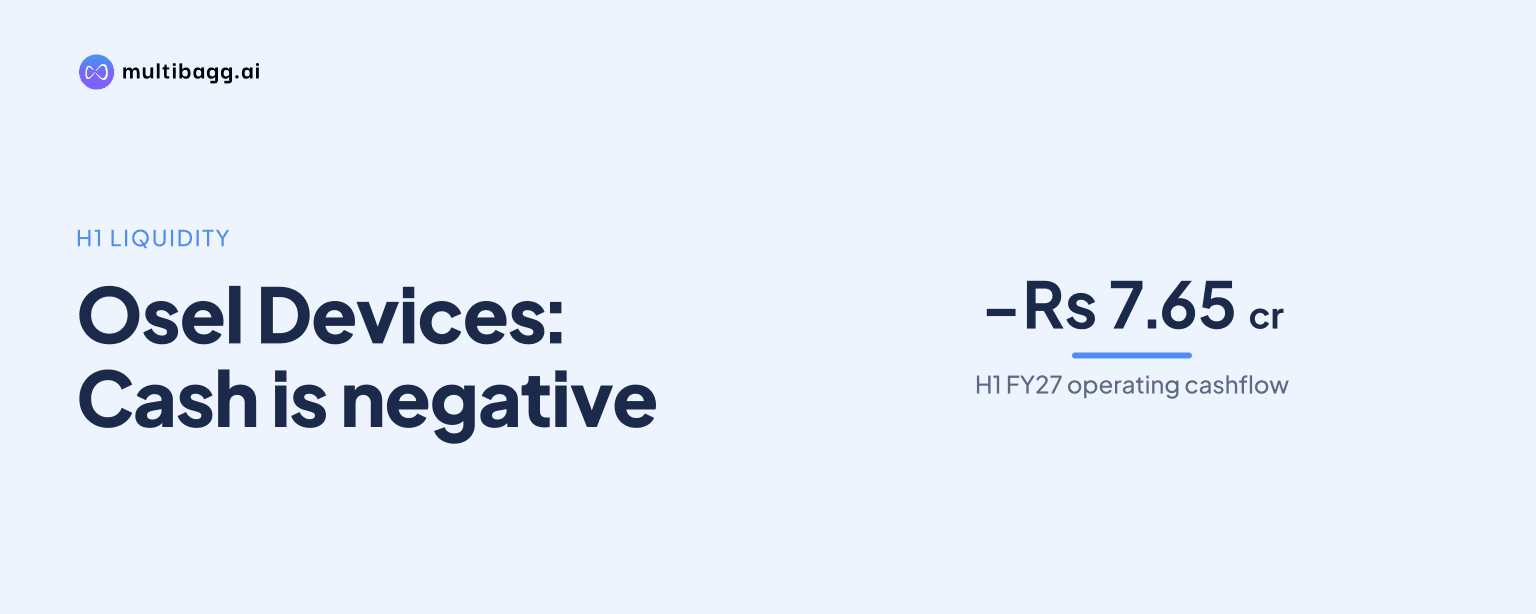
Osel Devices Limited reported negative operating cash flow of Rs 7.65 crore in H1 FY27 despite profit after tax of Rs 18.08 crore, as working-capital changes used Rs 43.35 crore. OSEL’s short-term borrowings rose to Rs 145.33 crore at 30 September 2026 from Rs 94.38 crore at 31 March 2026.
Know OSEL Devices inside out
Results, valuation, peers and who's buying, in one view.
Why was OSEL’s operating cash flow negative in H1 FY27?
OSEL’s operating cash flow was negative because Rs 43.35 crore of working-capital changes exceeded its Rs 35.71 crore operating profit before working-capital changes in H1 FY27. The company reported no income-tax payment in the half-year cash-flow statement, leaving net cash from operating activities at negative Rs 7.65 crore.
The cash outcome differed from the reported earnings trend. Revenue from operations rose 31.8% year on year to Rs 193.63 crore in H1 FY27, while profit after tax increased 19.1% to Rs 18.08 crore from Rs 15.19 crore in H1 FY26. OSEL’s earnings therefore increased, but more funds were tied up in operating balance-sheet accounts during the half-year.
The H1 FY27 operating outflow was smaller than the negative Rs 23.10 crore reported for FY26, although FY26 covers a full year and is not directly comparable with a half-year. The cash-flow statement begins with profit before tax of Rs 24.95 crore, while the profit-and-loss statement gives Rs 25.16 crore for H1 FY27; the presentation does not explain the Rs 0.21 crore difference.
Which balance-sheet items used OSEL’s cash?
OSEL’s trade receivables, inventories and other current assets were all higher at 30 September 2026 than at 31 March 2026. Trade receivables reached Rs 137.98 crore, inventories were Rs 73.65 crore and other current assets were Rs 99.53 crore as H1 FY27 revenue rose to Rs 193.63 crore.
The three listed current-asset categories increased by a combined Rs 86.13 crore, while trade payables increased by Rs 24.05 crore. Higher payables can partly offset cash tied up in receivables, inventories and other assets, but OSEL’s cash-flow statement reports a net working-capital outflow of Rs 43.35 crore after all working-capital movements.
The presentation’s cash-flow commentary gives different rounded changes for some of these accounts. It states that receivables rose Rs 27.8 crore, other current assets rose Rs 39.7 crore, inventory rose Rs 8.2 crore and payables rose Rs 20.9 crore. OSEL provides no reconciliation between those commentary figures and the movements calculated from the two balance-sheet dates.
How did OSEL fund its H1 FY27 cash requirements?
OSEL generated Rs 55.05 crore from financing activities in H1 FY27, exceeding the combined Rs 55.61 crore used in operating and investing activities. The result was a Rs 0.56 crore net decrease in cash in the cash-flow statement, from opening cash and cash equivalents of Rs 1.64 crore to closing cash and cash equivalents of Rs 1.08 crore.
Short-term borrowing was the largest identified financing source. OSEL’s cash-flow commentary cites Rs 51.0 crore of short-term borrowings and Rs 11.8 crore from a share issue, while the balance sheet shows short-term borrowings increased by Rs 50.96 crore during the half-year to Rs 145.33 crore.
Current liabilities rose to Rs 231.84 crore at 30 September 2026 from Rs 145.48 crore at 31 March 2026. Alongside the Rs 145.33 crore of short-term borrowings, the later balance included trade payables of Rs 58.63 crore and short-term provisions of Rs 21.97 crore; long-term borrowings declined to Rs 65.25 lakh from Rs 86.42 lakh.
The balance-sheet cash-and-cash-equivalents line was Rs 1.21 crore at 30 September 2026, compared with the cash-flow statement’s closing balance of Rs 1.08 crore. The presentation does not explain the Rs 13.69 lakh difference between those two reported closing figures.
Got a follow-up? Ask IRIS
What else used OSEL’s cash in H1 FY27?
OSEL used Rs 47.97 crore in investing activities during H1 FY27, compared with Rs 90.87 crore in FY26. The presentation attributes Rs 30.6 crore of the H1 FY27 investing use to other non-current assets and Rs 13.8 crore to an investment in a body corporate.
Other non-current assets increased by Rs 30.61 crore to Rs 41.71 crore at 30 September 2026 from Rs 11.10 crore at 31 March 2026. Property, plant and equipment rose Rs 1.38 crore to Rs 28.94 crore, while capital work in progress was unchanged at Rs 40.17 lakh.
OSEL also reported intangible assets of Rs 21.41 crore at 30 September 2026, compared with nil at 31 March 2026. Non-current investments declined to Rs 58,000 from Rs 16.25 crore, while current investments remained Rs 47.75 crore at both reporting dates. The presentation does not provide a line-by-line bridge between these balance-sheet changes and the investing cash outflow.
What disclosed plans could affect OSEL’s future cash needs?
OSEL’s stated strategy includes bringing phone assembly in house at scale, localising controllers with Colorlight, expanding SFL through partner-led clinics, and increasing CMS subscribers. The presentation says SFL had 41 clinics, CMS was live at more than 300 sites, and the Philips distribution network had 268 distributors.
Management also disclosed a plan to establish an export and original-equipment-manufacturing hub at the Jawaharlal Nehru Port Authority Special Economic Zone from April 2027. In LED displays, OSEL says the 10-year Bharat Mandapam public-private partnership adds about Rs 15 crore a year, while CMS at 1 lakh screens would mean about Rs 84 crore to Rs 96 crore a year; these are management-stated commercial opportunities rather than H1 FY27 cash receipts.
Conclusion
OSEL’s H1 FY27 results show that revenue and profit growth did not translate into positive operating cash flow. Revenue increased 31.8% to Rs 193.63 crore and profit after tax rose 19.1% to Rs 18.08 crore, but a Rs 43.35 crore working-capital outflow contributed to negative Rs 7.65 crore of operating cash flow, alongside a Rs 47.97 crore investing outflow and higher short-term borrowings.
The next disclosure to watch is OSEL’s progress toward the planned April 2027 Jawaharlal Nehru Port Authority Special Economic Zone hub, including any related investment or funding requirement. Readers can also monitor whether receivables, inventory, other current assets and short-term borrowings move in line with revenue, and whether the company reconciles the differing working-capital and closing-cash figures in the presentation.