










Pipavav Port container traffic rises 18% as cargo mix shifts
Key highlights
- Pipavav Port handled 192,944 TEU in Q2 FY 2027, up 18% year on year.
- Other-than-ICD container volume rose to 94,000 TEU from 55,000 TEU, while ICD volume fell to 99,000 TEU from 109,000 TEU.
- Dry bulk traffic declined 10% to 942,575 metric tonnes and liquid traffic fell 15% to 328,868 metric tonnes in Q2 FY 2027.
- Pipavav Port reported Q2 FY 2027 revenue of Rs 339.152 crore, up 13%, and EBITDA of Rs 211.820 crore, up 19%.
powered by IRIS
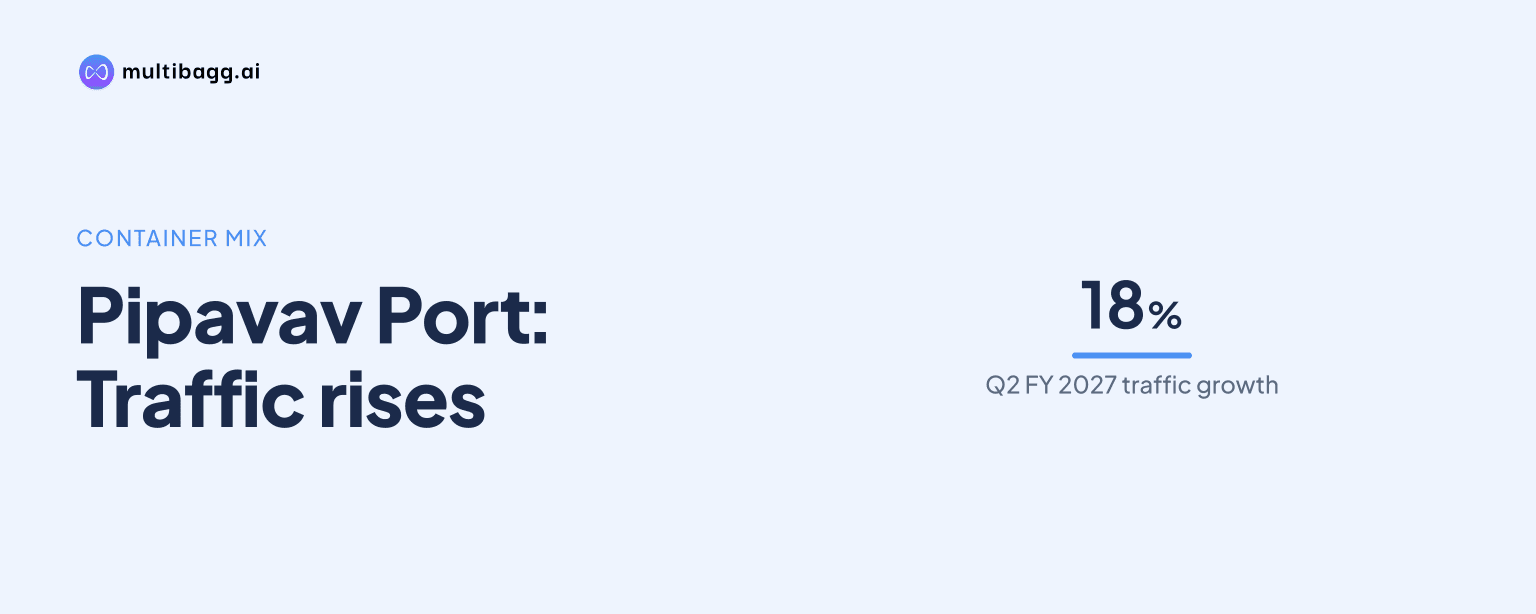
Gujarat Pipavav Port Limited reported Q2 FY 2027 container traffic of 192,944 TEU, up 18% year on year, because other-than-ICD cargo rose to 94,000 TEU from 55,000 TEU and outweighed a decline in ICD traffic to 99,000 TEU. Management cited Middle East conflict-related transshipment volume but did not quantify it.
Know Gujarat Pipavav Port inside out
Results, valuation, peers and who's buying, in one view.
Why did Pipavav Port's container traffic rise in Q2 FY 2027?
Pipavav Port's container traffic rose because growth in other-than-ICD cargo more than offset lower inland container depot, or ICD, volume. The company handled 192,944 TEU in Q2 FY 2027, up 18% year on year, and management identified conflict-related transshipment volume as a factor affecting container traffic.
The presentation does not disclose the number of TEU attributable to transshipment, so the conflict-related contribution cannot be measured. The rounded quarterly chart shows other-than-ICD cargo rising by 39,000 TEU, from 55,000 TEU to 94,000 TEU, while ICD volume fell by 10,000 TEU, from 109,000 TEU to 99,000 TEU.
How did Pipavav Port's container cargo mix change?
Pipavav Port's other-than-ICD cargo became the driver of container growth, reaching 94,000 TEU in Q2 FY 2027 versus 55,000 TEU in Q2 FY 2026. ICD cargo, which the presentation tracks separately, accounted for 99,000 TEU in Q2 FY 2027, below 109,000 TEU a year earlier.
Pipavav Port's rounded chart categories total 193,000 TEU for Q2 FY 2027, close to the reported 192,944-TEU quarterly total because the chart is expressed in thousands. The mix shift occurred even as trains serving ICD cargo fell by nine year on year to 452.
What do Pipavav Port's quarterly container trends show?
Pipavav Port's other-than-ICD volume increased in every quarter in the five-quarter series, rising from 55,000 TEU in Q2 FY 2026 to 67,000 TEU in Q3, 69,000 TEU in Q4, 80,000 TEU in Q1 FY 2027 and 94,000 TEU in Q2 FY 2027. The latest result was the highest in the disclosed series.
ICD volume followed a different path, declining from 109,000 TEU in Q2 FY 2026 to 107,000 TEU in Q3, 97,000 TEU in Q4 and 89,000 TEU in Q1 FY 2027 before recovering to 99,000 TEU in Q2 FY 2027. Train movements similarly rose sequentially from 346 in Q1 FY 2027 to 452 in Q2, but remained below 461 in Q2 FY 2026.
For the first half, Pipavav Port handled 361,603 TEU, up 10% year on year. That growth rate was below the 18% reported for Q2 alone, while roll-on/roll-off, or RoRo, volume rose 24% in the first half to 123,926 units.
Got a follow-up? Ask IRIS
How did Pipavav Port's other cargo segments compare?
Pipavav Port reported lower dry bulk and liquid traffic in Q2 FY 2027, unlike container and RoRo cargo. Dry bulk declined 10% to 942,575 metric tonnes, liquid fell 15% to 328,868 metric tonnes, and RoRo increased 3% to 58,515 units.
The rounded bulk chart shows fertilizer volume falling to 655,000 metric tonnes in Q2 FY 2027 from 803,000 metric tonnes a year earlier, while minerals and others increased to 288,000 metric tonnes from 249,000 metric tonnes. Management linked lower bulk imports of fertilizer and minerals, as well as lower liquefied petroleum gas imports, to the Middle East conflict.
In the first half, the divergence persisted: dry bulk volume fell 9% to 1,463,053 metric tonnes and liquid volume declined 32% to 550,048 metric tonnes. Container traffic increased 10% to 361,603 TEU, while RoRo traffic rose 24% to 123,926 units, which management attributed to higher exports from original equipment manufacturers.
What did the traffic mix mean for Pipavav Port's Q2 financial indicators?
Pipavav Port reported Q2 FY 2027 revenue from operations of Rs 339.152 crore, up 13% year on year, and said higher container and RoRo revenue supported the increase. Earnings before interest, tax, depreciation and amortisation, or EBITDA, rose 19% to Rs 211.820 crore, with EBITDA margin at 62% versus 59% a year earlier.
Operating expenditure rose 5% year on year to Rs 127.332 crore, below the revenue growth rate. Earnings before interest and tax increased 24% to Rs 180.717 crore, while reported net profit declined 6% to Rs 148.485 crore because the prior-year quarter included an insurance recovery.
Management said Q2 net profit was 18% higher after excluding the prior-year insurance recovery. For the first half, revenue from operations rose 22% to Rs 670.919 crore, EBITDA increased 31% to Rs 425.803 crore, and reported net profit rose 14% to Rs 295.362 crore.
Conclusion
Pipavav Port's Q2 FY 2027 growth was led by a change in container mix rather than an improvement in ICD cargo. Other-than-ICD volume added 39,000 TEU year on year, exceeding the 10,000-TEU decline in ICD volume, while dry bulk and liquid traffic fell and RoRo volume rose 3%.
The unresolved point is the scale and durability of the transshipment traffic that management linked to the Middle East conflict. The next quarterly disclosure will show whether other-than-ICD cargo can extend its rise beyond 94,000 TEU and whether ICD traffic and train movements can move above their Q2 FY 2026 levels of 109,000 TEU and 461 trains.