










POCL FY26 EBITDA doubles as lead output tops 100,000 tonnes
Key highlights
- POCL's FY26 revenue from operations rose to Rs 2,938.7 crore from Rs 2,028.3 crore in FY25.
- POCL's FY26 EBITDA reached Rs 218.1 crore, while EBITDA margin increased to 7.4% from 5.3%.
- POCL produced 104,481 metric tonnes of lead and sold 100,727 metric tonnes in FY26.
- POCL's FY26 interest coverage increased to 19.99 times, while net debt was Rs 139.8 crore.
powered by IRIS
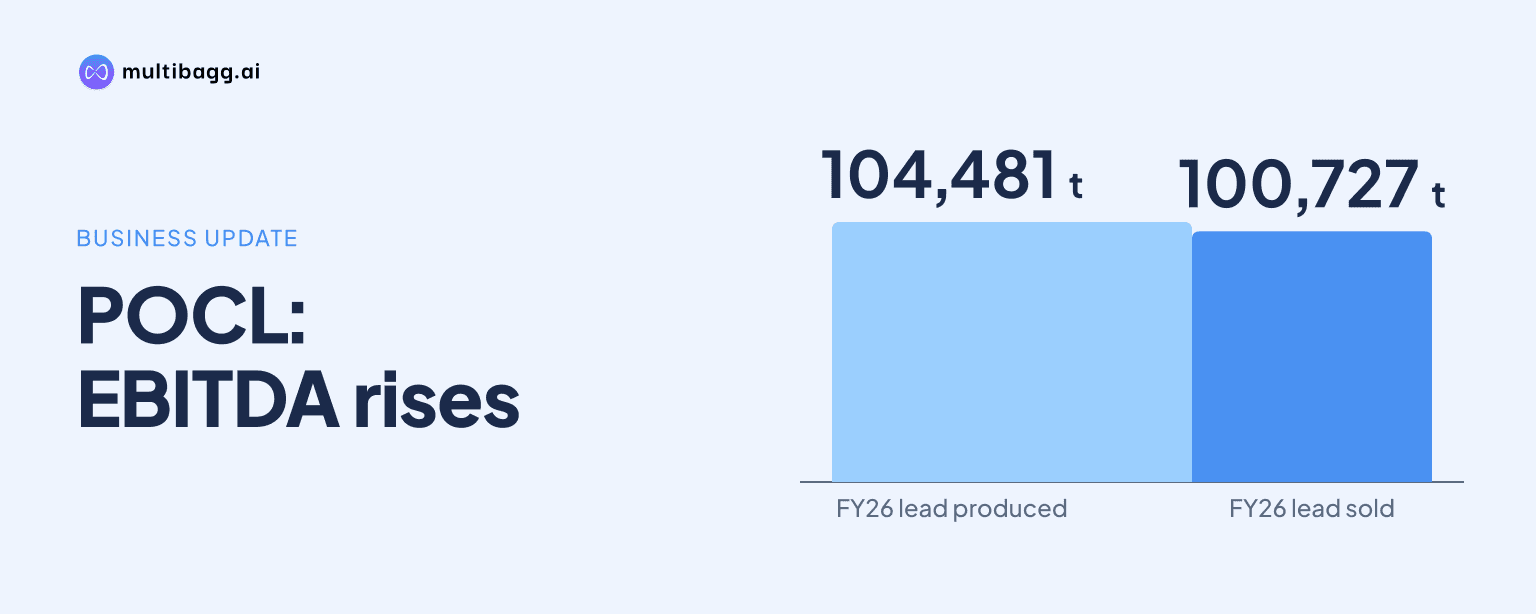
POCL® reported FY26 EBITDA of Rs 218.1 crore, more than double Rs 107.6 crore in FY25, while lead production rose to 104,481 metric tonnes. Revenue from operations increased to Rs 2,938.7 crore from Rs 2,028.3 crore, and EBITDA margin expanded to 7.4% from 5.3%.
Know Pondy Oxides & Chemicals inside out
Results, valuation, peers and who's buying, in one view.
What drove POCL's FY26 financial step-up?
POCL's FY26 financial step-up reflected increases in revenue, gross profit, operating profit and profit after tax. Revenue from operations rose by Rs 910.4 crore to Rs 2,938.7 crore in FY26 from Rs 2,028.3 crore in FY25. Gross profit increased by Rs 131 crore to Rs 343.8 crore, while EBITDA increased by Rs 110.5 crore to Rs 218.1 crore.
Profit after tax, or PAT, rose to Rs 138.7 crore in FY26 from Rs 65.1 crore in FY25, an increase of Rs 73.6 crore. The rise followed FY24, when POCL reported revenue of Rs 1,523.8 crore, EBITDA of Rs 77.2 crore and PAT of Rs 39.5 crore. The presentation attributes the FY24 PAT decline to increased finance cost.
POCL's FY26 revenue was above the Rs 1,454.8 crore to Rs 1,523.8 crore range recorded between FY22 and FY24. EBITDA had remained between Rs 77.2 crore and Rs 82.7 crore across those three financial years before reaching Rs 107.6 crore in FY25 and Rs 218.1 crore in FY26. The increase in gross profit, EBITDA and PAT alongside revenue indicates that the FY26 change extended beyond sales growth.
How did POCL's margins and profitability change in FY26?
POCL expanded all three reported profitability margins in FY26. Gross margin increased to 11.7% from 10.5% in FY25, EBITDA margin increased to 7.4% from 5.3%, and PAT margin increased to 4.7% from 3.2%. The 2.1 percentage-point increase in EBITDA margin was larger than the 1.2 percentage-point gross-margin increase and the 1.5 percentage-point PAT-margin increase.
The FY26 EBITDA margin of 7.4% was above the 5.1% to 5.6% range reported from FY22 to FY25. Gross margin recovered from FY25's 10.5% but remained below FY23's 12.0%. PAT margin of 4.7% exceeded the 2.6% to 3.3% range shown for FY22 through FY25.
Return on equity rose to 17% in FY26 from 11% in FY24 and FY25, although it remained below the 23% reported in FY22. POCL attributes the FY24 return-on-equity decline to an increase in equity share capital. Its FY26 export share was 66%, unchanged from FY25 but above the 54% reported in FY22.
Got a follow-up? Ask IRIS
Did POCL's lead production and sales support FY26 growth?
POCL's lead production and sales both exceeded 100,000 metric tonnes in FY26. Lead production increased by 10,366 tonnes to 104,481 tonnes from 94,115 tonnes in FY25. Lead sales increased by 10,162 tonnes to 100,727 tonnes from 90,565 tonnes, placing sales above 100,000 tonnes for the first time in the FY21-to-FY26 series shown.
FY26 production was 44,198 tonnes higher than FY21 production of 60,283 tonnes, while sales were 41,596 tonnes above FY21 sales of 59,131 tonnes. The series also shows a decline from FY22 production of 77,282 tonnes to FY24 production of 72,531 tonnes, before output increased to 94,115 tonnes in FY25 and 104,481 tonnes in FY26.
The difference between FY26 lead production and sales was 3,754 tonnes, compared with a 3,550-tonne difference in FY25. POCL states that its post-expansion lead capacity is 204,000 metric tonnes per annum, or MTPA, across its facilities. The FY26 production figure was therefore below the stated annual lead capacity, although the presentation does not disclose capacity utilisation.
How did POCL's balance-sheet measures change in FY26?
POCL reported net debt of Rs 139.8 crore in FY26, compared with Rs 63.4 crore in FY25 and Rs 64.6 crore in FY24. Net debt to equity increased to 0.17 times from 0.11 times in FY25. It remained below the 0.50 times reported in FY22 and the 0.56 times reported in FY23.
Interest coverage increased to 19.99 times in FY26 from 8.28 times in FY25 and 4.16 times in FY24. POCL notes that the FY24 interest-coverage decline was due to an increase in finance cost. The FY26 coverage figure coincided with EBITDA of Rs 218.1 crore, compared with Rs 107.6 crore a year earlier.
Net working-capital days increased to 53 in FY26 from 50 in FY25. Receivable days increased to 24 from 21, inventory days declined to 31 from 32, and payable days declined to two from three. FY26 working-capital days remained below the 56 days in FY22 and 58 days in FY23.
Conclusion
POCL's FY26 results show simultaneous growth in reported scale, margins and lead volumes. Revenue reached Rs 2,938.7 crore, EBITDA reached Rs 218.1 crore and lead production reached 104,481 tonnes, compared with Rs 2,028.3 crore, Rs 107.6 crore and 94,115 tonnes respectively in FY25. Net debt rose to Rs 139.8 crore, while interest coverage increased to 19.99 times.
The next disclosed execution points are POCL's post-expansion lead capacity of 204,000 MTPA and copper capacity of 12,000 MTPA, plus a plan for 36,000 MTPA of copper cathode capacity in two phases. Management also states that it is targeting more than 60% share of value-added products, while lithium-ion is at the feasibility stage and rubber and e-waste are at the pre-feasibility stage.