










Prevest Denpro H1 PAT rises 20.9% as revenue grows 18.3%
Key highlights
- Prevest Denpro reported H1 FY 26-27 consolidated PAT of Rs 12.03 crore, up 20.9% year on year.
- H1 FY 26-27 consolidated revenue from operations rose 18.3% to Rs 40.71 crore.
- H1 consolidated EBITDA margin was unchanged at 39.0%, while PAT margin rose to 27.6% from 27.1%.
- Prevest Denpro disclosed a Rs 1.00-per-share interim dividend for H1 FY27, approved on 12 November 2026.
powered by IRIS
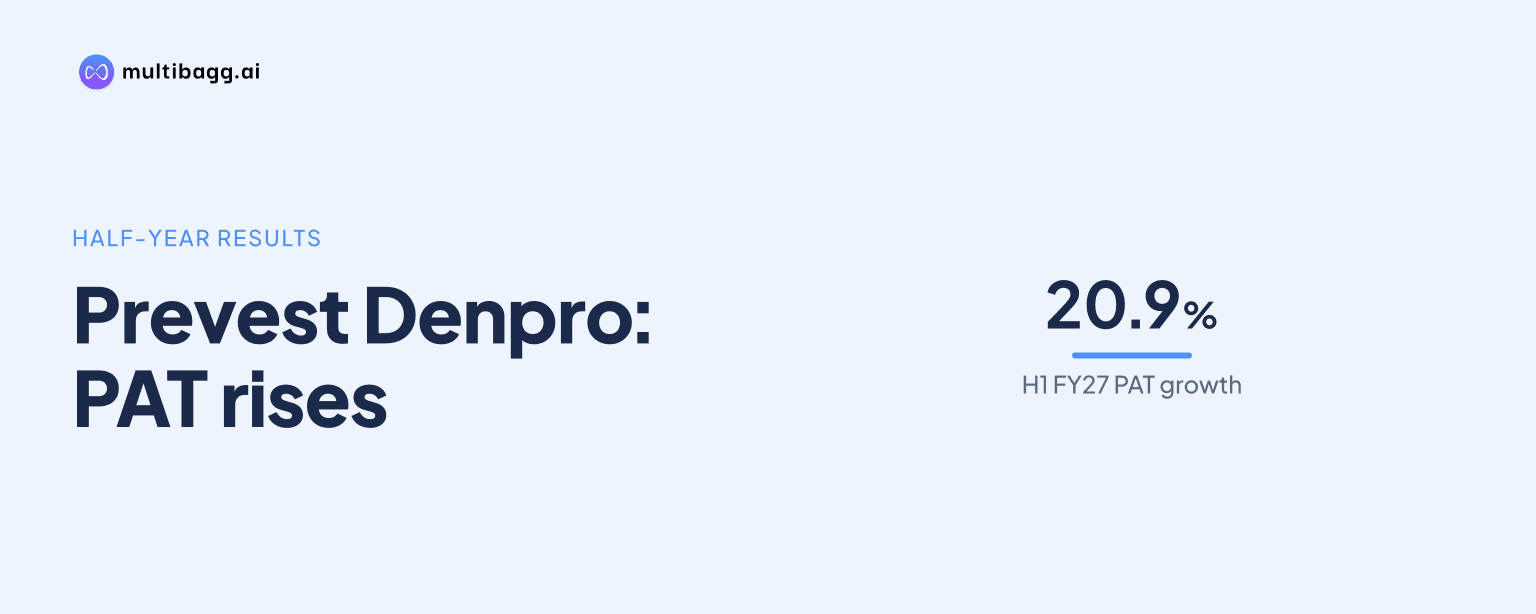
Prevest Denpro Limited reported consolidated profit after tax of Rs 12.03 crore in H1 FY 26-27, up 20.9% year on year, as revenue from operations increased 18.3% to Rs 40.71 crore and earnings before interest, tax, depreciation and amortisation margin remained 39.0%.
Know Prevest Denpro inside out
Results, valuation, peers and who's buying, in one view.
How did Prevest Denpro perform in H1 FY 26-27?
Prevest Denpro grew consolidated profit faster than revenue in H1 FY 26-27. Revenue from operations increased by Rs 6.30 crore from H1 FY 25-26 to Rs 40.71 crore, while profit after tax, or PAT, rose by Rs 2.08 crore to Rs 12.03 crore. Total income increased 18.5% to Rs 43.57 crore from Rs 36.77 crore.
Operating and pre-tax profit also increased in the half year. Earnings before interest, tax, depreciation and amortisation, or EBITDA, rose 18.4% to Rs 16.99 crore from Rs 14.35 crore. Profit before tax, or PBT, increased 19.4% to Rs 15.95 crore from Rs 13.36 crore, and PBT margin moved to 36.6% from 36.3%.
Did Prevest Denpro maintain margins while revenue grew?
Prevest Denpro maintained a consolidated EBITDA margin of 39.0% in H1 FY 26-27, unchanged from H1 FY 25-26. The Rs 6.30 crore increase in revenue from operations was accompanied by a Rs 2.64 crore increase in EBITDA, keeping the reported operating margin level across the two half-year periods.
Profitability below EBITDA improved in the half year. PAT margin rose by 0.5 percentage points to 27.6% from 27.1%, while PBT margin rose by 0.3 percentage points to 36.6%. PAT growth of 20.9% exceeded revenue growth of 18.3%, whereas EBITDA growth of 18.4% broadly tracked revenue growth.
The standalone result was higher than the consolidated result on the disclosed measures. Standalone H1 FY 26-27 revenue from operations was Rs 41.13 crore, up 19.6%, and standalone PAT was Rs 12.41 crore, up 21.6%. Standalone EBITDA margin was 39.4%, compared with 39.0% on the consolidated basis, while standalone PAT margin was 28.2% against 27.6%.
What did Prevest Denpro report for Q2 FY 26-27?
Prevest Denpro reported consolidated Q2 FY 26-27 revenue from operations of Rs 21.64 crore, up 16.1% from Rs 18.64 crore in Q2 FY 25-26. Quarterly PAT increased 15.3% to Rs 6.39 crore from Rs 5.54 crore, while total income rose 16.9% to Rs 23.19 crore.
Q2 operating profit increased at a slower rate than revenue. EBITDA rose 13.2% to Rs 8.91 crore, but EBITDA margin was 38.4%, compared with 39.7% a year earlier. PBT increased 13.8% to Rs 8.39 crore and PBT margin declined to 36.2% from 37.2%.
PAT margin in Q2 was 27.6%, compared with 27.9% in Q2 FY 25-26. The H1 PAT margin increased to 27.6% from 27.1%, but the second-quarter year-on-year comparison showed a 0.3-percentage-point decline. The presentation does not provide a segment-level explanation for the quarterly margin movement.
Got a follow-up? Ask IRIS
How did Prevest Denpro's Q2 compare with Q1?
Prevest Denpro's consolidated Q2 revenue from operations was 13.5% higher than Q1 FY 26-27, increasing from Rs 19.07 crore to Rs 21.64 crore. Total income rose 13.8% sequentially to Rs 23.19 crore from Rs 20.38 crore, making Q2 the larger contributor to the Rs 43.57 crore H1 total.
PAT increased 13.3% quarter on quarter to Rs 6.39 crore from Rs 5.64 crore. PBT rose 11.0% to Rs 8.39 crore, while EBITDA increased 10.3% to Rs 8.91 crore from Rs 8.08 crore. Because revenue grew faster than EBITDA, EBITDA margin declined to 38.4% from 39.6%.
PAT margin was comparatively stable at 27.6% in Q2 and 27.7% in Q1, while PBT margin declined to 36.2% from 37.1%. The presentation therefore shows higher revenue and profit in Q2 than Q1, alongside lower EBITDA, PBT and PAT margins in the later quarter. It does not disclose quarterly revenue by product category, customer type or geography.
What has Prevest Denpro disclosed on dividends and its market?
Prevest Denpro disclosed an interim dividend of Rs 1.00 per share for H1 FY27, equal to 10% of face value, with board approval dated 12 November 2026. The presentation also reports zero long-term debt and says its capital-allocation approach balances capacity expansion, research and development funding, and dividend payouts.
Management's presentation estimates the India dental consumables market at $1.73 billion in 2025 and projects $3.63 billion in 2033, implying a 9.7% compound annual growth rate from 2025 to 2033. It states that India represents 4.4% of the global market and identifies digital dentistry and 3D printing as market-growth drivers.
Prevest Denpro lists restorative materials, endodontic solutions, preventive care, orthodontic adhesives, impression materials and cements, digital dentistry and disinfectants in its product ecosystem. The digital dentistry range includes 3D-printing resins and computer-aided design and computer-aided manufacturing materials, but the presentation does not quantify revenue or margin by product category.
Conclusion
Prevest Denpro's H1 FY 26-27 results show revenue from operations rising 18.3% to Rs 40.71 crore and PAT increasing 20.9% to Rs 12.03 crore. EBITDA margin remained 39.0% for the half year, while PBT and PAT margins rose to 36.6% and 27.6%, respectively, despite margin reductions in Q2 versus both Q1 and the prior-year quarter.
The next disclosed matters to watch are management's execution of its stated balance among capacity expansion, research and development funding and dividend payouts after the Rs 1.00-per-share interim dividend approved on 12 November 2026. Management projects a 9.7% compound annual growth rate for India's dental consumables market through 2033, but the presentation does not disclose a company revenue target, segment forecast or capacity-expansion figure.