










Puravankara has 3,644 completed units awaiting recognition
Key highlights
- Puravankara had 3,644 completed units covering 4.28 msft pending recognition on September 30, 2026.
- Puravankara handed over 977 units in Q2 FY27, up from 745 units in Q1 FY27.
- Completed projects had 87% of launched area sold and 1.49 msft of residual inventory.
- Puravankara had 25.02 msft under construction and 8.58 msft planned for future launch.
powered by IRIS
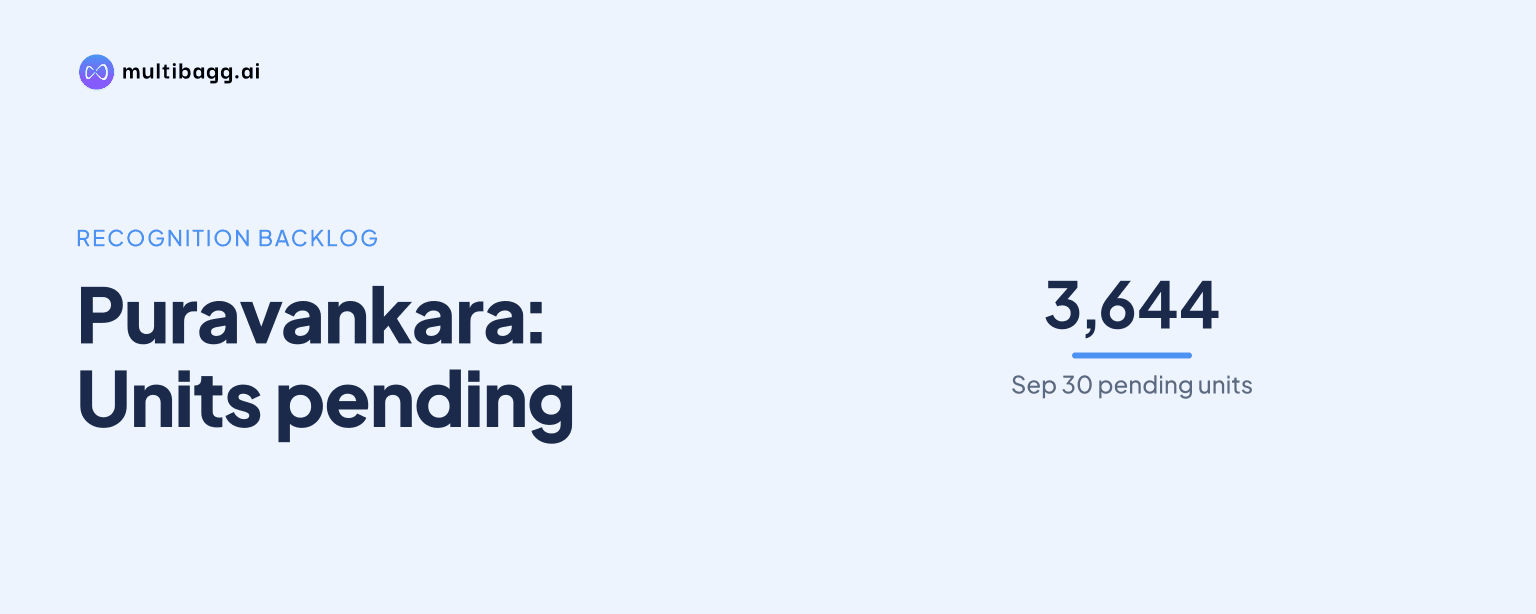
Puravankara Limited had 3,644 completed units covering 4.28 million square feet (msft) pending recognition on September 30, 2026, following 977 possession handovers in Q2 FY27. The balance rose from 2,777 units and 3.20 msft in Q1 FY27, and management called it a built-in tailwind for FY27.
Know Puravankara inside out
Results, valuation, peers and who's buying, in one view.
How many Puravankara completed units are pending recognition?
Puravankara had 3,644 completed units pending recognition as of September 30, 2026, with an associated area of 4.28 msft. The presentation says this completed inventory was under process of being handed over and links consistent handovers to future collections and profitability.
The pending balance increased by 867 units from 2,777 units in Q1 FY27, while the area increased by 1.08 msft from 3.20 msft. Against Q2 FY26, pending units were higher by 1,292 from 2,352, and pending area rose by 1.31 msft from 2.97 msft.
Puravankara did not disclose a rupee value, a project-wise split, or quarterly timing for recognising the 3,644 units. Management described the 4.28 msft balance as a built-in tailwind for FY27, but the presentation does not quantify the expected contribution to FY27 collections or profitability.
How many homes did Puravankara hand over in Q2 FY27?
Puravankara handed over 977 units, covering 0.97 msft, in Q2 FY27. This was 232 units above the 745 handed over in Q1 FY27, while handover area increased by 0.03 msft from 0.94 msft.
The Q2 FY27 total was also 314 units above the 663 handovers in Q2 FY26, and area rose by 0.30 msft from 0.67 msft. Management characterises the move from 663 units in Q2 FY26 to 977 units in Q2 FY27 as accelerating handover momentum.
Handover volumes did not rise in every quarter in the six-quarter record. Q4 FY26 was the highest period shown, at 1,301 units and 1.67 msft, followed by a decline to 745 units and 0.94 msft in Q1 FY27 before the Q2 FY27 recovery.
What does Puravankara's completed-project inventory show?
Puravankara reported 12.61 msft of completed inventory across 11,203 total units as of September 30, 2026, with 87% of launched area sold. On Puravankara's share basis, the completed portfolio comprised 11.64 msft and 10,402 units, including 10.14 msft sold cumulatively.
Residual inventory at completed sites was 1.49 msft across 1,019 units, or 13% of launched area. This is a different measure from the 4.28 msft and 3,644 units pending recognition: both appear in the presentation, but Puravankara does not provide a reconciliation between them.
The completed-project table excludes projects with fewer than 10 units of inventory because the company describes them as not material. The 1.49 msft residual figure therefore represents remaining sales inventory at listed completed sites, whereas the 4.28 msft figure refers to completed inventory pending recognition.
Got a follow-up? Ask IRIS
Which Puravankara completed projects have the most residual inventory?
Puravankara's largest listed residual completed inventory was at Soukhyam in Guduvancheri, Chennai, at 0.55 msft across 301 units. That balance represented 40% of Soukhyam's 1.37 msft of launched area, compared with the portfolio-wide 13% residual inventory rate.
Adora De Goa in Zuari Nagar, Goa had the next-largest residual area at 0.35 msft and 293 units, equal to 22% of its 1.57 msft launched area. One Park Avenue (Panorama) in Thane had 0.22 msft across 170 units remaining, or 53% of its 0.41 msft launched area.
Several completed projects were nearer full sell-through. Park Square in Bengaluru had sold 99% of 1.94 msft launched, while Capella, Kenworth, Tivoli Hills and Silversand-I had each sold 98% of their launched area. These project figures relate to residual saleable stock rather than the handover-related recognition balance.
How does the completed backlog compare with Puravankara's wider pipeline?
Puravankara's 4.28 msft of completed inventory pending recognition was smaller than its 25.02 msft under-construction developable area as of September 30, 2026. The under-construction portfolio contained 26 open-for-sale residential projects, with 13.48 msft sold cumulatively and 7.93 msft of inventory.
Bengaluru represented 12.84 msft, or 51%, of the 25.02 msft under-construction area, followed by Chennai at 4.76 msft and Mumbai at 3.24 msft. Under-construction inventory was 2.98 msft in Bengaluru and 2.89 msft in Chennai, compared with 0.90 msft in Mumbai, 0.80 msft in Pune and 0.34 msft in Kochi.
Puravankara also listed 8.58 msft across 11 phases or projects not yet open for sale, taking total ongoing and future-launch developable area to 33.61 msft. The future-launch pipeline included 2,618 unsold units on the group's share basis, but management specifically linked the 4.28 msft completed balance to FY27 collections and profitability.
Conclusion
Puravankara's Q2 FY27 possession count of 977 units was higher than the 745 units in Q1 FY27 and 663 in Q2 FY26, although it remained below Q4 FY26's 1,301 units. At the same time, the completed balance pending recognition reached 3,644 units and 4.28 msft, distinct from the 1.49 msft of residual saleable inventory at completed sites.
The next disclosed operating item is the processing of handovers for the 3,644 completed units, which management says can support FY27 collections and profitability. Readers can track subsequent quarterly possession volumes against the Q4 FY26 peak of 1,301 units, as well as sales progress across 7.93 msft of under-construction inventory and the 8.58 msft future-launch pipeline.