










Puravankara H1 sales rise 46% as realisations gain 26%
Key highlights
- Puravankara reported H1 FY27 sales value of Rs 3,575 crore, up 46% year on year.
- Average realisation rose 26% to Rs 11,199 per square foot in H1 FY27.
- Homes priced above Rs 2 crore contributed 29% of H1 FY27 sales value, up from 19%.
- Q2 FY27 customer collections reached Rs 1,301 crore, up 24% year on year.
powered by IRIS
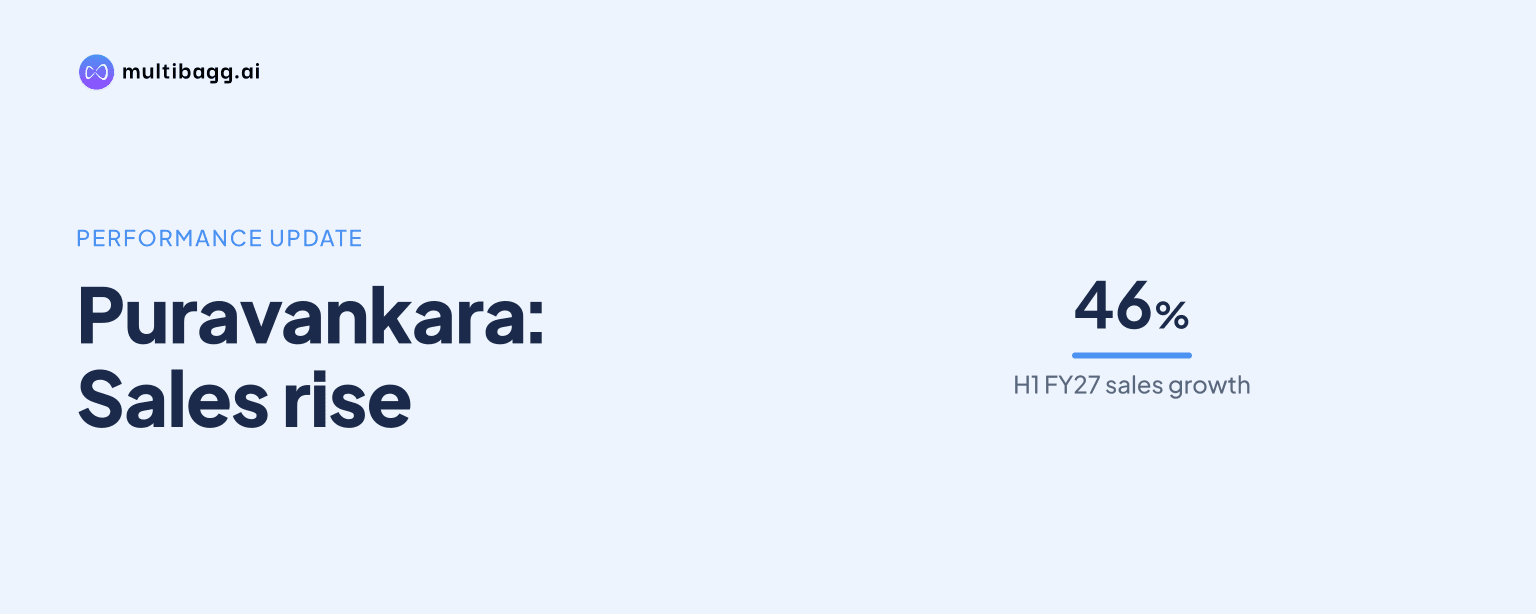
Puravankara Limited reported first-half fiscal year 2027 (H1 FY27) sales value of Rs 3,575 crore, up 46% year on year, as average realisation rose 26% to Rs 11,199 per square foot and sales volume increased 16% to 3.19 million square feet. Higher pricing and a changed product mix contributed alongside additional area sold.
Know Puravankara inside out
Results, valuation, peers and who's buying, in one view.
How did Puravankara grow H1 FY27 sales value by 46%?
Puravankara grew H1 FY27 sales value to Rs 3,575 crore from Rs 2,455 crore in its headline business highlights, a 46% increase, while sales volume rose to 3.19 million square feet from 2.75 million square feet, or 16%. The difference between value growth and area growth coincided with a 26% increase in average realisation to Rs 11,199 per square foot from Rs 8,891 per square foot.
The detailed H1 sales table reports the previous-year total sales value as Rs 2,445 crore, rather than the Rs 2,455 crore shown in the headline highlights, while retaining the stated 46% growth rate. Puravankara describes sales as bookings reported in the respective period and says group gross sales include landowners’ economic interest under revenue-share arrangements, amounting to 0.30 million square feet in H1 FY27 versus 0.05 million square feet in H1 FY26.
Units sold increased 8% to 2,420 in H1 FY27 from 2,246 a year earlier, a slower rate than the 16% rise in saleable area. The presentation defines saleable area as the basis for sales volume, meaning the sales-value increase was accompanied by growth in both transaction count and average area sold, but pricing increased more rapidly than either measure.
What changed in Puravankara's home-price mix in H1 FY27?
Puravankara’s sales share from homes priced above Rs 2 crore increased to 29% in H1 FY27 from 19% in H1 FY26, a 10-percentage-point shift. At the same time, the share from homes below Rs 1 crore declined to 34% from 51%, while the Rs 1 crore to Rs 2 crore category increased to 37% from 30%.
Homes priced below Rs 2 crore still accounted for 71% of Puravankara’s H1 FY27 sales value, combining the 34% share below Rs 1 crore and the 37% share in the Rs 1 crore to Rs 2 crore band. Management attributed the 26% improvement in average realisation to better product mix, premiumisation and pricing strength across markets.
The movement was concentrated at both ends of the price range: the below-Rs-1-crore band lost 17 percentage points, while homes above Rs 2 crore added 10 percentage points. The middle band also expanded by 7 percentage points, so the presentation shows a lower contribution from entry-price homes rather than a shift only from the middle category into higher-value homes.
Which Puravankara regions drove sales and realisations?
Puravankara’s South business delivered Rs 2,608 crore of H1 FY27 sales value, up 44% from Rs 1,809 crore, with area sold increasing 25% to 2.55 million square feet. Its average realisation in the South increased 16% to Rs 10,223 per square foot, and the presentation cites the March 2026 launch of Purva Northern Lights and sustained sales as drivers.
West and Commercial sales value increased 52% to Rs 967 crore despite area sold declining 9% to 0.64 million square feet and unit sales falling 38% to 404. Average realisation in that segment rose 66% to Rs 15,083 per square foot from Rs 9,082 per square foot, explaining how sales value increased while physical sales measures contracted.
Within West and Commercial, ongoing projects recorded a 76% rise in H1 FY27 realisation to Rs 15,911 per square foot, while their area sold fell 26% to 0.51 million square feet. Completed projects in the segment contributed Rs 162 crore of sales value, compared with Rs 12 crore a year earlier, although the prior-period base was only 0.01 million square feet of area sold.
Got a follow-up? Ask IRIS
How did Puravankara's second quarter compare with H1 FY27?
Puravankara reported second-quarter fiscal year 2027 (Q2 FY27) sales value of Rs 2,136 crore, up 62% from Rs 1,322 crore in Q2 FY26, exceeding the 46% H1 growth rate. Q2 sales volume increased 22% to 1.83 million square feet, units sold grew 12% to 1,403, and average realisation rose 32% to Rs 11,651 per square foot.
The Q2 result included Rs 1,562 crore of sales value in the South, up 63%, and Rs 574 crore in West and Commercial, up 58%. Puravankara linked South growth to Purva Northern Lights, while it said West and Commercial growth reflected the September 2026 launch of Miami and sustained sales; West and Commercial ongoing-project realisation rose 92% to Rs 17,317 per square foot.
Customer collections reached Rs 1,301 crore in Q2 FY27, 24% above Rs 1,047 crore in Q2 FY26 and the highest second-quarter collection in the last three years, according to Puravankara. The company also reported H1 FY27 collections of Rs 2,500 crore, up 31% from Rs 1,904 crore, while total revenue rose 60% to Rs 1,928 crore and profit after tax was Rs 107 crore versus a Rs 111 crore loss in H1 FY26.
What do Puravankara's geographic sales shares show?
Puravankara derived 62% of H1 FY27 sales value from Bengaluru, up from 53% in H1 FY26, while Chennai’s contribution increased to 16% from 13%. Mumbai and Pune together accounted for 18%, down from 25%, and the share classified as others fell to 4% from 9%.
Sales volume from outside the Bengaluru real-estate market was about 38% in H1 FY27, compared with 47% in H1 FY26. Puravankara said the increase in Chennai’s contribution to 16% indicated a growing presence in that region, while H1 FY27 launches were concentrated in Bengaluru, which accounted for 0.92 million square feet, or 81%, of the 1.13 million square feet launched.
Puravankara completed 2.13 million square feet during H1 FY27, compared with 1.13 million square feet launched in the same period. Completions comprised 1.00 million square feet in Goa, 0.62 million square feet in Mumbai and 0.50 million square feet in Pune, while the company reported 33.61 million square feet of ongoing area across its portfolio.
Conclusion
Puravankara’s H1 FY27 sales expansion combined a 16% rise in area sold with a 26% increase in average realisation, producing 46% sales-value growth to Rs 3,575 crore. The move in mix toward homes above Rs 2 crore, whose share rose to 29% from 19%, and the 66% rise in West and Commercial realisation were material components of the period’s pricing outcome.
Next, readers can watch the conversion of H1 FY27 launches and the company’s 33.61 million square feet of ongoing area into sales and collections. Puravankara launched 1.13 million square feet in H1 FY27, including 0.66 million square feet at Equinox 6 in Bengaluru, and reported 14.50 million square feet of planned and launch pipeline area across its active markets.