










Q-Line Biotech FY26 EBITDA hit Rs 98 crore, cash flow Rs 16 crore
Key highlights
- Q-Line Biotech reported FY26 EBITDA of Rs 98 crore, up from Rs 71 crore in FY25.
- A Rs 61 crore working-capital outflow reduced FY26 net operating cash flow to Rs 16 crore.
- Trade receivables increased by Rs 43 crore to Rs 126 crore at Mar-26.
- Q-Line Biotech reported FY26 gross profit margin of 60.8%, versus 53.3% in FY25.
powered by IRIS
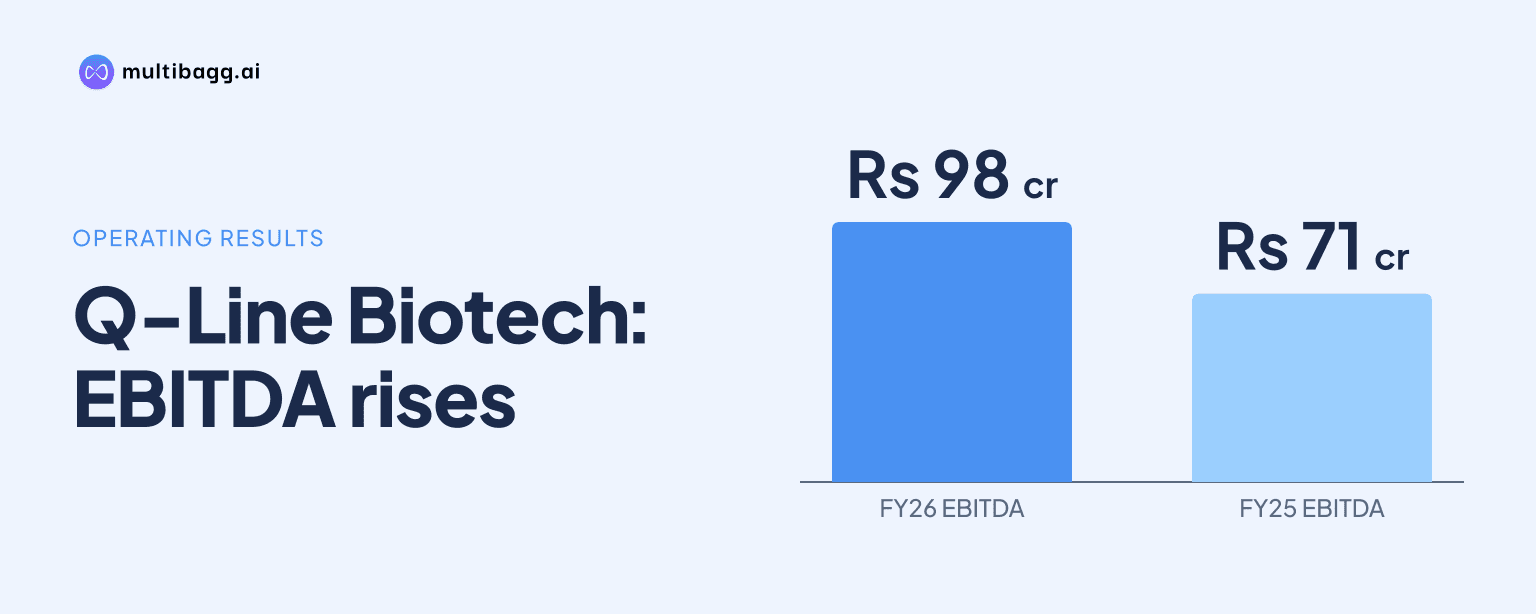
Q-Line Biotech Limited reported financial year 2026 (FY26) earnings before interest, tax, depreciation and amortisation (EBITDA) of Rs 98 crore, yet net cash from operating activities was Rs 16 crore after a Rs 61 crore working-capital outflow and Rs 26 crore of direct taxes paid. EBITDA increased from Rs 71 crore in FY25, while operating cash flow declined from Rs 17 crore.
Know Q-Line Biotech inside out
Results, valuation, peers and who's buying, in one view.
Why was Q-Line Biotech's FY26 operating cash flow Rs 16 crore?
Q-Line Biotech generated Rs 103 crore of operating profit before working-capital changes in FY26, but a Rs 61 crore working-capital outflow reduced cash generated from operations to Rs 42 crore. Net direct taxes paid of Rs 26 crore then reduced net cash from operating activities to Rs 16 crore. The cash-flow outcome was therefore affected by movements in operating assets and liabilities as well as reported earnings.
The gap appeared alongside higher operating earnings. EBITDA increased by Rs 27 crore, from Rs 71 crore in FY25 to Rs 98 crore in FY26, while net cash from operating activities decreased by Rs 1 crore, from Rs 17 crore to Rs 16 crore. Operating profit before working-capital changes rose by Rs 14 crore from Rs 89 crore, but the working-capital outflow remained sizeable at Rs 61 crore after Rs 63 crore in FY25.
How did working capital absorb Rs 61 crore in FY26?
Q-Line Biotech's balance sheet shows trade receivables rising by Rs 43 crore, from Rs 83 crore at Mar-25 to Rs 126 crore at Mar-26, while inventories increased by Rs 5 crore to Rs 95 crore. These movements show that more funds were represented in customer dues and stock at the FY26 year end. The cash-flow statement separately records an aggregate Rs 61 crore working-capital outflow.
Other current-balance movements were mixed in FY26. Short-term loans and advances increased from Rs 33 crore to Rs 37 crore, while other current assets declined from Rs 12 crore to Rs 10 crore. Trade payables fell from Rs 56 crore to Rs 52 crore, other current liabilities declined from Rs 25 crore to Rs 22 crore, and short-term provisions decreased from Rs 16 crore to Rs 6 crore. The presentation does not provide a line-by-line bridge from these categories to the Rs 61 crore cash-flow amount.
What changed in Q-Line Biotech's FY26 earnings and margins?
Q-Line Biotech increased net revenue from operations by Rs 29 crore to Rs 342 crore in FY26, while gross profit rose by Rs 41 crore to Rs 208 crore. Gross profit margin increased to 60.8% from 53.3% in FY25. Cost of goods sold declined from Rs 146 crore to Rs 134 crore despite the revenue increase, according to the consolidated profit and loss statement.
EBITDA margin rose to 28.7% in FY26 from 22.5% in FY25 as EBITDA reached Rs 98 crore. Employee expenses increased by Rs 10 crore to Rs 40 crore and other expenses rose by Rs 4 crore to Rs 70 crore, while gross profit increased by Rs 41 crore. Profit after tax rose to Rs 56 crore from Rs 19 crore, with finance cost increasing from Rs 15 crore to Rs 19 crore and depreciation rising from Rs 7 crore to Rs 11 crore.
Got a follow-up? Ask IRIS
How were investment spending and financing reflected in FY26 cash flow?
Q-Line Biotech reported Rs 29 crore of net cash used in investing activities and Rs 42 crore of net cash from financing activities in FY26. The cash-flow statement records a Rs 29 crore net increase in cash and cash equivalents, following Rs 16 crore from operations, Rs 29 crore used for investing and Rs 42 crore generated through financing. In FY25, the investing outflow was Rs 77 crore and the financing inflow was Rs 53 crore.
Borrowings increased on the consolidated balance sheet in FY26. Long-term borrowings rose by Rs 14 crore to Rs 96 crore, while short-term borrowings increased by Rs 46 crore to Rs 129 crore. Property, plant and equipment and intangible assets increased from Rs 74 crore at Mar-25 to Rs 142 crore at Mar-26, while capital work-in-progress declined from Rs 63 crore to Rs 19 crore. The presentation does not identify individual financing instruments or link each borrowing movement to a specific investment outlay.
What should readers note about Q-Line Biotech's reported cash balances?
Q-Line Biotech's cash-flow statement reports cash and cash equivalents of Rs 41 crore at the end of FY26, compared with Rs 13 crore at the beginning of the period. Its consolidated balance sheet, however, reports cash and cash equivalents of Rs 76 crore at Mar-26 and Rs 47 crore at Mar-25. The presentation does not provide a reconciliation between the cash-flow-statement figures and the balance-sheet figures.
The annual financials also show a difference in reported profit before tax. The cash-flow statement gives FY26 profit before tax as Rs 73 crore, whereas the profit and loss statement gives Rs 74 crore. Both exhibits appear in the FY26 annual financials, but the presentation does not explain the difference. Readers therefore have the reported operating, investing and financing movements without a disclosed reconciliation of every cash-related line item across the exhibits.
Conclusion
Q-Line Biotech's FY26 financials show higher revenue, gross margin and EBITDA, with EBITDA reaching Rs 98 crore and gross profit reaching Rs 208 crore. However, the Rs 61 crore working-capital outflow and Rs 26 crore tax payment restricted net operating cash flow to Rs 16 crore. Receivables of Rs 126 crore and inventories of Rs 95 crore provide balance-sheet context for that absorption, although the presentation does not provide a complete working-capital bridge.
Management plans to ramp up Unit 4 towards full-scale operations in H2 FY27, using 36 product licences to support in-house manufacturing of diagnostic reagents and kits. Readers can watch whether that expansion coincides with changes in receivables, inventory, borrowings and operating cash flow, and whether Q-Line Biotech provides a reconciliation for the cash figures reported across its FY26 financial statements.