










Q-line Biotech H1 EBITDA Rises 10.0% While PAT Falls 8.1%
Key highlights
- Q-line Biotech’s H1 FY27 revenue rose 5.8% to Rs 152 crore.
- Q-line Biotech’s H1 FY27 EBITDA increased 10.0% to Rs 40 crore and margin reached 26.0%.
- Q-line Biotech’s H1 FY27 PAT fell 8.1% to Rs 20 crore as depreciation reached Rs 8 crore.
- Q-line Biotech’s reagent business grew 19.23%, while instrument revenue declined 29.71%.
powered by IRIS
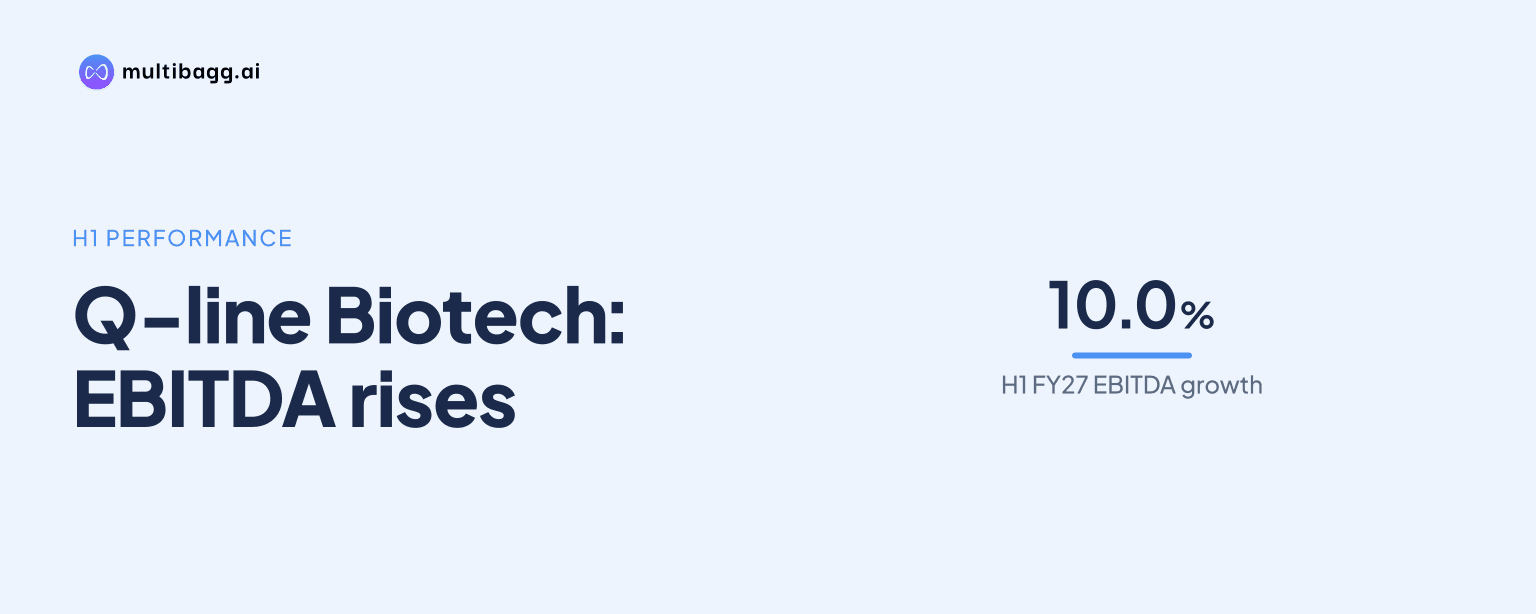
Q-line Biotech Limited reported H1 FY27 net revenue of Rs 152 crore, up 5.8%, and EBITDA of Rs 40 crore, up 10.0%, while profit after tax fell 8.1% to Rs 20 crore. Management cited higher depreciation following Unit 4’s capitalisation and a Rs 1.95 crore tax write-back in H1 FY26.
Know Q-Line Biotech inside out
Results, valuation, peers and who's buying, in one view.
How did Q-line Biotech perform in H1 FY27?
Q-line Biotech increased revenue and operating profit in H1 FY27, while reported profit after tax declined. Net revenue from operations rose to Rs 152 crore from Rs 144 crore in H1 FY26, a gain of Rs 8 crore or 5.8%. Earnings before interest, tax, depreciation and amortisation, or EBITDA, increased by Rs 4 crore to Rs 40 crore, outpacing revenue growth at 10.0%.
The difference between operating and bottom-line performance is also visible in margins. Gross profit margin rose to 62.6% from 57.7%, while EBITDA margin increased to 26.0% from 25.0%. However, profit after tax, or PAT, margin fell to 12.9% from 14.8%, and earnings per share declined to Rs 10.47 from Rs 13.53.
Why did Q-line Biotech PAT fall despite EBITDA growth?
Q-line Biotech said PAT fell primarily because depreciation increased after Unit 4, identified as C-42, was capitalised in Q4 FY26, while H1 FY26 included a one-time tax write-back of Rs 1.95 crore. Depreciation doubled to Rs 8 crore in H1 FY27 from Rs 4 crore a year earlier. The company also reported finance cost of Rs 10 crore, compared with Rs 8 crore in H1 FY26.
Profit before tax remained unchanged at Rs 26 crore across the two half-year periods despite the Rs 4 crore rise in EBITDA. Other income increased to Rs 4 crore from Rs 3 crore, while taxes were Rs 6 crore compared with Rs 5 crore. Management’s explanation identifies both the Unit 4 depreciation and the prior-year non-recurring tax item as reasons why PAT did not follow the improvement in EBITDA.
The Unit 4 project remains central to management’s H2 FY27 plans. Management said regulatory approvals took longer than anticipated, but product licences increased from 9 on September 30, 2026, to 36 on November 5, 2026. It expects Unit 4 to become fully operational during H2 FY27 and progressively contribute as manufacturing operations scale up.
Which businesses drove Q-line Biotech’s revenue mix?
Q-line Biotech’s reagent business was the main growth contributor in H1 FY27, rising 19.23%, while instrument revenue fell 29.71%. Management attributed the instrument decline primarily to the non-availability of consignees for certain government orders, which affected supply execution and delivery. Government business was stable against the corresponding prior period, whereas trade business grew 20.13%.
Reagents accounted for 72% of H1 FY27 revenue, making them the largest product category, followed by instruments at 21%. Consumables represented 6% and services 1%. This mix shows that the 19.23% reagent growth occurred in the largest reported product bucket, while the 29.71% instrument decline affected a smaller, though still material, share of sales.
Government customers generated 69% of H1 FY27 revenue and private customers generated 31%. Geographically, North India accounted for 77% of revenue, compared with 13% from East India and 5% from South India; exports were 0.3%. Management said it is working to strengthen institutional relationships, extend distribution reach and improve order execution.
Got a follow-up? Ask IRIS
What changed in Q-line Biotech’s cost structure and margins?
Q-line Biotech’s gross profit increased by Rs 12 crore to Rs 95 crore, exceeding the Rs 8 crore revenue increase, as cost of goods sold fell to Rs 57 crore from Rs 61 crore. As a result, gross margin expanded by 4.9 percentage points to 62.6%. The presentation does not provide a product-level cost bridge, so it does not identify the specific source of the lower cost of goods sold.
Operating expenses nevertheless rose in H1 FY27. Employee expenses increased to Rs 19 crore from Rs 16 crore, and other expenses rose to Rs 37 crore from Rs 31 crore. These increases totalled Rs 9 crore, while EBITDA still rose by Rs 4 crore because gross profit expanded by Rs 12 crore. EBITDA margin consequently moved up by 1.0 percentage point to 26.0%.
The profit and loss statement records no extraordinary item or prior-period expense in either H1 FY27 or H1 FY26, and no share in the profit or loss of associates. That presentation separates the reported Rs 20 crore PAT from management’s narrative about the Rs 1.95 crore tax write-back in the prior year. The disclosed figures show a Rs 1 crore fall in PAT even though operating profit rose.
What do Q-line Biotech’s balance sheet and cash flow show?
Q-line Biotech reported total equity of Rs 482 crore at September 2026, compared with Rs 246 crore at March 2026, while total liabilities increased to Rs 690 crore from Rs 559 crore. Long-term borrowings fell to Rs 33 crore from Rs 96 crore and short-term borrowings fell to Rs 99 crore from Rs 129 crore. The H1 FY27 financial snapshot reported a debt-to-equity ratio of 0.27 times.
Current assets rose to Rs 490 crore at September 2026 from Rs 344 crore at March 2026. Within current assets, inventories increased to Rs 108 crore from Rs 95 crore, trade receivables increased to Rs 138 crore from Rs 126 crore, and cash and bank balance rose to Rs 186 crore from Rs 76 crore. Total assets and total liabilities were both reported at Rs 690 crore at September 2026.
The cash-flow statement reports net cash from operations of negative Rs 9 crore, cash flow from investing activities of negative Rs 110 crore, and financing cash flow of Rs 112 crore in the column labelled September 2026. It reports cash and cash equivalents of Rs 33 crore at the end of the period, compared with Rs 41 crore at the beginning. Cash and bank balance of Rs 186 crore is a separate balance-sheet line from cash and cash equivalents of Rs 33 crore.
Conclusion
Q-line Biotech’s H1 FY27 results show higher revenue, gross profit and EBITDA alongside lower reported PAT. Revenue rose 5.8% to Rs 152 crore and EBITDA grew 10.0% to Rs 40 crore, supported by a 4.9-percentage-point increase in gross margin. The Rs 20 crore PAT reflected higher Rs 8 crore depreciation and management’s comparison with a Rs 1.95 crore prior-year tax write-back.
The next disclosed operating milestone is management’s expectation that Unit 4 will be fully operational in H2 FY27, after product licences rose to 36 by November 5, 2026. Management also plans to accelerate reagent and trade growth, improve instrument-sales execution and pursue a proposed majority-stake acquisition in Heidelberg Medicare Private Limited, which it says could provide cross-selling and distribution opportunities.