










QMS Revenue Reached Rs 172.9 Crore as FY26 Returns Fell
Key highlights
- QMS net revenue from operations rose from Rs 104 crore in FY23 to Rs 172.9 crore in FY26.
- FY26 PAT declined to Rs 11.9 crore from Rs 13.7 crore in FY25, while PAT margin fell to 6.9% from 8.8%.
- Debt to equity rose to 0.7 times in FY26 and interest coverage fell to 3.5 times from 5.0 times in FY25.
- QMS generated Rs 19.4 crore of operating cash in FY26 and used Rs 20.4 crore in investing activities.
powered by IRIS
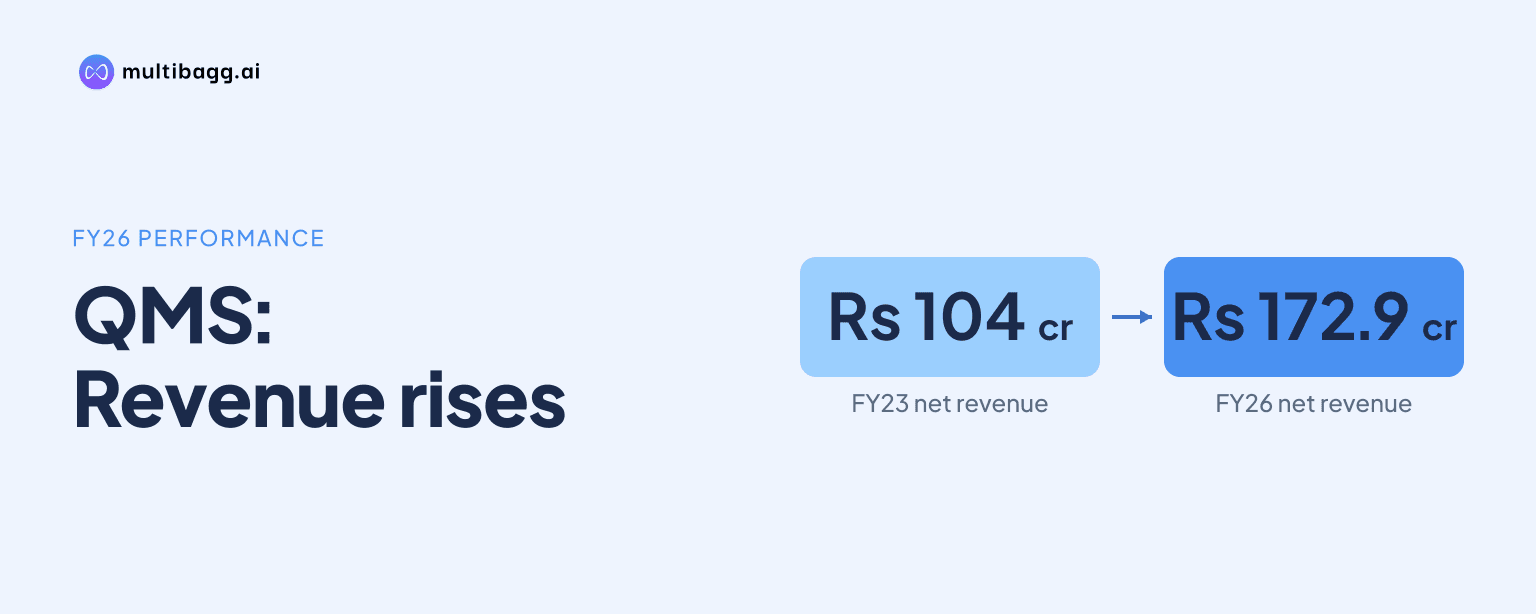
QMS Medical Allied Services Ltd. reported FY26 net revenue from operations of Rs 172.9 crore, up from Rs 104 crore in FY23, while profit after tax fell to Rs 11.9 crore and return on equity declined to 10.5% from 12.8% in FY25.
Know QMS Medical Allied Services inside out
Results, valuation, peers and who's buying, in one view.
How did QMS revenue and EBITDA change?
QMS increased net revenue from operations in each reported year, reaching Rs 172.9 crore in FY26 from Rs 104 crore in FY23, an 18% compound annual growth rate stated in the presentation. Revenue rose to Rs 122.1 crore in FY24 and Rs 156 crore in FY25, but the FY26 increase of Rs 16.9 crore was lower than the Rs 33.9 crore increase in FY25.
Earnings before interest, tax, depreciation and amortisation, or EBITDA, rose from Rs 11.3 crore in FY23 to Rs 25.9 crore in FY26, representing a 32% compound annual growth rate in the presentation. EBITDA grew by Rs 0.5 crore in FY26 after a Rs 7.1 crore increase in FY25, and its margin fell to 15.0% from the FY25 level of 16.3%.
The FY26 cost movements coincided with the margin change. Cost of goods sold increased to Rs 92.6 crore from Rs 81.6 crore in FY25, while employee expenses rose to Rs 15.2 crore from Rs 9.6 crore; other expenses were Rs 39.2 crore, against Rs 39.4 crore in FY25.
Why did QMS profit and margins decline in FY26?
QMS reported FY26 profit after tax, or PAT, of Rs 11.9 crore, down from Rs 13.7 crore in FY25 despite higher revenue and EBITDA. PAT margin declined to 6.9% from 8.8%, reversing the increase from 6.1% in FY23 to 7.4% in FY24 and 8.8% in FY25.
Higher finance cost was a disclosed movement below EBITDA. Finance cost increased to Rs 6.6 crore in FY26 from Rs 4.6 crore in FY25 and Rs 2.3 crore in FY23, while other income declined to Rs 1.1 crore from Rs 1.7 crore. Depreciation was Rs 3.9 crore in FY26, compared with Rs 3.8 crore a year earlier.
As a result, profit before tax before exceptional items declined to Rs 16.4 crore from Rs 18.7 crore. Taxes fell to Rs 4.5 crore from Rs 5 crore, but this did not offset the lower pre-tax profit; the consolidated profit and loss statement reports no exceptional gain or loss in FY23 through FY26.
How did QMS returns, debt and interest coverage change?
QMS’s return on equity, or ROE, declined to 10.5% in FY26 from 12.8% in FY25, while return on capital employed, or ROCE, fell to 12.2% from 13.9%. Both measures remained above FY23 levels of 9.1% for ROE and 11.5% for ROCE, but FY26 marked a retreat from their FY25 readings.
Debt to equity rose to 0.7 times in FY26 from 0.6 times in FY25 and 0.4 times in FY23 and FY24. Interest coverage moved down to 3.5 times from 5.0 times in FY25, following 4.8 times in FY23 and 4.9 times in FY24.
The balance sheet records Rs 68.5 crore of short-term borrowings at March 2026, up from Rs 50.8 crore at March 2025 and Rs 24.1 crore at March 2023. Long-term borrowings fell to Rs 7 crore from Rs 9.4 crore over FY25, leaving total borrowings at Rs 75.5 crore versus Rs 60.2 crore a year earlier; shareholders’ funds were Rs 109.9 crore at March 2026.
Got a follow-up? Ask IRIS
What does QMS cash flow show about investment and working capital?
QMS generated Rs 19.4 crore of net cash from operating activities in FY26, compared with Rs 20.1 crore in FY25, Rs 1.4 crore in FY24 and an outflow of Rs 7.5 crore in FY23. Cash generated from operations before direct taxes was Rs 24.1 crore in FY26, while working-capital changes used Rs 1.1 crore after adding Rs 3.5 crore in FY25.
Investing activities used Rs 20.4 crore in FY26, lower than the Rs 45.5 crore outflow in FY25 but close to FY26 operating cash generation. Financing activities provided Rs 1.1 crore, down from Rs 25.9 crore in FY25, and cash and cash equivalents ended FY26 at Rs 1.2 crore.
Trade receivables increased to Rs 65 crore at March 2026 from Rs 57.9 crore at March 2025, while inventories rose to Rs 45.9 crore from Rs 39.3 crore. Total current assets reached Rs 136.6 crore and total current liabilities were Rs 92.2 crore, compared with Rs 120 crore and Rs 73.1 crore respectively a year earlier.
What expansion plans has QMS disclosed?
QMS has disclosed the acquisition of a 100% stake in BeamOptics to expand into diagnostics and technology. The presentation says BeamOptics adds in-house research and development, product innovation, regulatory capabilities and manufacturing, to be combined with QMS’s sales, marketing and nationwide distribution network.
QMS also describes consolidating its patient support programme, or PSP, operations with HCAH’s PSP operations under Saarathi Healthcare and HCAH. Management proposes a separate National Stock Exchange listing for that healthcare-services platform, but the presentation gives no timetable, valuation, funding amount or expected financial contribution.
Point-of-care screening and diagnostics are identified as routes to accelerate PSP enrolments and device adoption. The roadmap also cites chronic-disease burden, access initiatives, affordability and demand for structured PSPs as industry factors, rather than setting FY26 financial targets.
Conclusion
QMS expanded revenue by Rs 68.9 crore between FY23 and FY26 and increased EBITDA to Rs 25.9 crore, but FY26 produced lower reported profitability and coverage measures. PAT declined to Rs 11.9 crore, EBITDA margin fell to 15.0%, ROE moved to 10.5%, and interest coverage decreased to 3.5 times as finance cost reached Rs 6.6 crore.
The next disclosed developments to watch are the integration of the 100% BeamOptics acquisition and the proposed separate National Stock Exchange listing of the consolidated PSP business. Subsequent results can show whether operating cash flow of Rs 19.4 crore, investing outflows of Rs 20.4 crore and short-term borrowings of Rs 68.5 crore change alongside these plans.