










Raymond Group shifts debt mix as liquidity reaches Rs 2,791 crore
Key highlights
- Raymond Group reduced short-term debt’s share of gross borrowings from 74% in 2020 to 38% in 2026.
- Liquidity rose to Rs 2,791 crore at 31 March 2026 from Rs 571 crore at 31 March 2020.
- Long-term debt reached Rs 1,975 crore at 31 March 2026, versus Rs 644 crore six years earlier.
- Raymond Group reported an 8.22% average borrowing cost and 4.24-year average debt maturity at 31 March 2026.
powered by IRIS
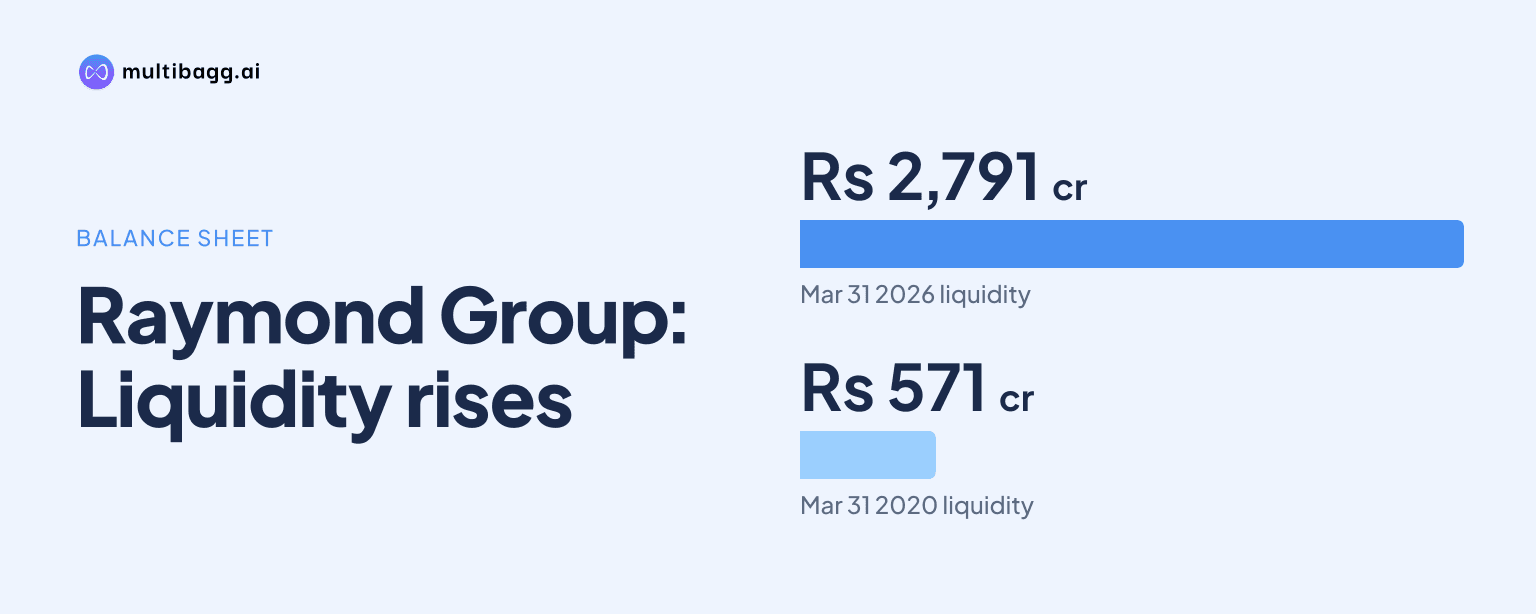
Raymond Group reduced short-term debt to 38% of gross borrowings at 31 March 2026 from 74% at 31 March 2020, while liquidity increased to Rs 2,791 crore from Rs 571 crore. The shift reflected Rs 1,237 crore of short-term debt and Rs 1,975 crore of long-term debt at March 2026.
Know Raymond Realty inside out
Results, valuation, peers and who's buying, in one view.
What changed in Raymond Group’s debt composition?
Raymond Group moved the larger share of its borrowings towards long-term funding between 31 March 2020 and 31 March 2026. Short-term debt declined by Rs 549 crore, from Rs 1,786 crore to Rs 1,237 crore, while long-term debt increased by Rs 1,331 crore, from Rs 644 crore to Rs 1,975 crore. The presentation states that short-term debt accounted for 74% of gross debt in 2020 and 38% in 2026.
Gross borrowings, calculated as short-term plus long-term debt, were Rs 2,430 crore in March 2020, Rs 2,125 crore in March 2023 and Rs 3,212 crore in March 2026. From March 2023 to March 2026, long-term debt increased by Rs 602 crore and short-term debt rose by Rs 485 crore. Raymond Group describes the resulting change as a transition from high-pressure short-term debt to stable long-term financing.
How much liquidity did Raymond Group build?
Raymond Group reported Rs 2,791 crore of liquidity at 31 March 2026, up Rs 2,220 crore from Rs 571 crore at 31 March 2020. Liquidity also rose by Rs 1,415 crore from Rs 1,376 crore at 31 March 2023. At March 2026, liquidity exceeded short-term debt of Rs 1,237 crore by Rs 1,554 crore.
Raymond Group defines liquidity as cash and cash equivalents, bank balances, current investments, market value of marketable securities within non-current investments, margin money, and deposits held for more than 12 months. In its separate 30 September 2026 executive-summary snapshot, Raymond Group reported cash reserves equal to 82% of borrowings and consolidated annual earnings before interest, tax, depreciation and amortisation, or EBITDA, of Rs 1,738 crore on a trailing-12-month basis.
Liquidity at March 2026 remained Rs 421 crore below calculated gross borrowings of Rs 3,212 crore, although the two measures are not directly identical because the presentation’s liquidity definition includes investments, margin money and longer-dated deposits. The March 2026 balance was nearly five times the Rs 571 crore reported in March 2020, while short-term debt was lower than its 2020 level.
What happened to Raymond Group’s debt cost and maturity?
Raymond Group’s average borrowing cost was 8.22% at 31 March 2026, compared with 8.60% at 31 March 2020 and 8.50% at 31 March 2023. The cost was 8.20% in March 2021, fell to 7.90% in March 2022, then rose to 8.73% in March 2024 before declining to 8.21% in March 2025. The March 2026 rate was 0.38 percentage points below the March 2020 figure.
The average maturity of debt was 4.24 years at 31 March 2026, according to the presentation. Net debt to EBITDA was 0.26 times at that date, versus 3.04 times in March 2020 and 0.54 times in March 2023. Raymond Group defines net debt as gross debt less cash balances, making the negative 0.36-times reading in March 2025 consistent with cash balances exceeding gross debt under that measure.
The net debt-to-EBITDA series also reached 10.48 times in March 2021, before falling to 1.25 times in March 2022. It subsequently measured 1.17 times in March 2024, negative 0.36 times in March 2025 and 0.26 times in March 2026. These measures combine the presentation’s gross-debt and cash-balance definitions rather than separating the maturity buckets shown in the debt table.
Got a follow-up? Ask IRIS
How did listed entities contribute to Raymond Group’s balance sheet?
Raymond Group reported consolidated cash balances of Rs 3,382 crore, long-term debt of Rs 1,647 crore and net long-term debt of negative Rs 1,736 crore at 30 September 2026. Raymond Lifestyle Limited held Rs 1,924 crore of cash against Rs 436 crore of long-term debt, while Raymond Realty Limited held Rs 308 crore of cash and Rs 768 crore of long-term debt. Raymond Limited reported Rs 1,151 crore of cash and Rs 443 crore of long-term debt.
The consolidated net debt-to-EBITDA ratio was 0.43 times at 30 September 2026, compared with 0.26 times at 31 March 2026. Funds from operations, or FFO, were Rs 1,027 crore on a trailing-12-month basis against EBITDA of Rs 1,738 crore, which the presentation shows as 59% conversion. Raymond Group defines FFO as EBITDA less cash tax paid.
The reported average maturities of long-term debt differed across the three listed entities at 30 September 2026. Raymond Lifestyle Limited reported 4.65 years, Raymond Realty Limited reported 3.9 years and Raymond Limited reported 4.57 years. Raymond Realty Limited also reported net debt-to-EBITDA of 1.70 times, compared with negative 0.05 times for Raymond Lifestyle Limited and negative 0.34 times for Raymond Limited.
What operating trends accompanied Raymond Group’s funding transition?
Raymond Group’s Lifestyle business reported FY26 revenue of Rs 6,888 crore and EBITDA of Rs 804 crore, compared with Rs 6,177 crore and Rs 651 crore in FY25. Its FY26 EBITDA remained below Rs 1,091 crore in FY24, even as FY26 revenue exceeded the Rs 6,535 crore recorded in FY24. The presentation reports a 19% revenue compound annual growth rate and a 67% EBITDA compound annual growth rate for the Lifestyle business over FY21 to FY26.
The Realty business reported FY26 revenue of Rs 2,991 crore and EBITDA of Rs 495 crore, up from Rs 2,320 crore and Rs 437 crore in FY25. The Engineering business reported revenue of Rs 2,212 crore in FY26, compared with Rs 1,947 crore in FY25, while EBITDA was unchanged at Rs 335 crore in both years. The presentation reports FY21-to-FY26 EBITDA compound annual growth rates of 86% for Realty and 32% for Engineering.
Portfolio EBITDA was Rs 488 crore in Q2FY27, up 11% from Rs 439 crore in Q2FY26, while September 2026 year-to-date portfolio EBITDA rose 15% to Rs 792 crore from Rs 690 crore. Raymond Lifestyle Limited accounted for Rs 270 crore, or 55%, of Q2FY27 portfolio EBITDA, while Raymond Realty Limited and Raymond Limited contributed Rs 115 crore and Rs 103 crore, respectively.
Conclusion
Raymond Group’s reported balance-sheet transition combined a lower short-term-debt share with a larger long-term-debt balance and a substantially higher liquidity pool. Between March 2020 and March 2026, liquidity increased by Rs 2,220 crore while short-term debt declined by Rs 549 crore, and the average borrowing cost ended 0.38 percentage points below its March 2020 level.
The next reported debt mix, liquidity balance and funding cost will show whether the March 2026 position is sustained. Raymond Group reported a 4.24-year average debt maturity and 8.22% borrowing cost at March 2026, followed by a 0.43-times consolidated net debt-to-EBITDA ratio at 30 September 2026; the presentation does not set out a future debt-reduction target or refinancing timetable.