










Reliance Industries Limited ethane advantage widens to $557/MT
Key highlights
- RIL’s ethane-versus-naphtha cracking differential reached $557 per metric tonne in Q2 FY27, or 2.3 times the CY 2025 average.
- US ethane prices rose 5% year on year to 24.3 cents per gallon, while naphtha prices rose 43% to $815 per metric tonne.
- Global cracker operating rates improved to 71% in Q2 FY27 from 68% in Q1 FY27, but remained below 81% in Q2 FY26.
- RIL received a second very large ethane carrier in October 2026 as it expands ethane sourcing under its feedstock-flexibility plan.
powered by IRIS
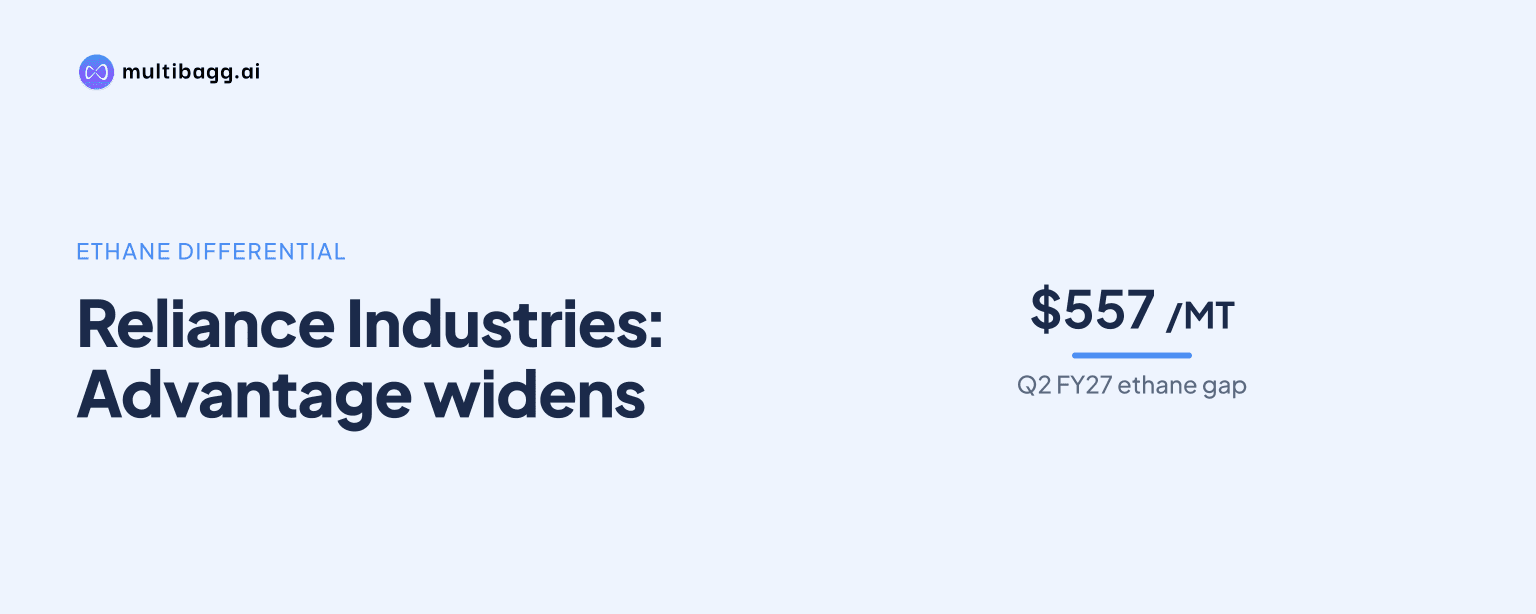
Reliance Industries Limited reported that the ethane-versus-naphtha cracking differential widened to $557 per metric tonne in Q2 FY27, 2.3 times the CY 2025 average. RIL said US ethane prices rose 5% year on year, while naphtha prices rose 43% and Northeast Asian naphtha crackers faced negative margins and rationalisation.
Know Reliance Industries inside out
Results, valuation, peers and who's buying, in one view.
Why did RIL's ethane advantage widen?
RIL's ethane advantage widened because Middle East naphtha supply and logistics were disrupted while US ethane pricing remained comparatively stable. Naphtha flow from the Middle East was 6.5 million metric tonnes (MMT) in Q2 FY27, versus 12.5 MMT before the conflict. RIL said Middle East flows partly recovered during the quarter but were still about 6 MMT per quarter below pre-war levels.
The cost gap was compounded by freight. Naphtha freight from the Arabian Gulf to Japan rose from $86 per metric tonne in July 2026 to $186 per metric tonne in September 2026, while the Q2 FY27 average was $122 per metric tonne, about three times the year-earlier level. US ethane averaged 24.3 cents per gallon, or cpg, in Q2 FY27, only 5% above the prior year.
RIL attributed the naphtha price increase to higher crude prices caused by Middle East supply disruptions. Naphtha assessed against Mean of Platts Singapore, or MOPS, averaged $815 per metric tonne in Q2 FY27, up 43% year on year. The company said US ethane remained rangebound, supporting superior cracker economics relative to naphtha-based production.
How did ethane and naphtha cracker margins compare?
Ethane cracking retained positive margins across every period shown by RIL, while naphtha cracking recorded losses in Q1 and Q3 CY26. RIL's internal estimates calculate Southeast Asia spot ethylene prices less total cash costs. The ethane calculation includes US ethane, freight, terminating costs and duty, while the naphtha calculation uses Free on Board Singapore naphtha pricing.
In Q3 CY26, the integrated ethane cracker margin was $439 per metric tonne, compared with a $117-per-metric-tonne loss for an integrated naphtha cracker. That $556-per-metric-tonne gap followed a $657-per-metric-tonne gap in Q2 CY26, when ethane margin was $708 per metric tonne and naphtha margin was $51 per metric tonne. The reported Q2 FY27 differential of $557 per metric tonne indicates that the relative feedstock advantage remained wide.
The divergence occurred as supply disruption reduced the global olefins surplus. RIL reported that 41.2 million metric tonnes a year of polyethylene, or PE, capacity was affected globally, alongside 12.8 million metric tonnes a year of monoethylene glycol, or MEG, and 32 million metric tonnes a year of purified terephthalic acid, or PTA. It said downstream chemical margins increased with the supply shock despite structural global overcapacity.
What happened to global cracker operating rates?
Global cracker operating rates improved to 71% in Q2 FY27 from 68% in Q1 FY27, but remained below 81% in Q2 FY26. RIL attributed the sequential increase mainly to marginal normalisation from conflict-related operating disruptions. Constraints on moving feedstocks and exporting products continued to limit Middle East and Africa operations.
The United States recorded the highest regional operating rate at 90% in Q2 FY27, up from 89% in both comparative periods. RIL said low-cost ethane and export opportunities supported US crackers. Middle East and Africa utilisation recovered from 40% in Q1 FY27 to 48%, but remained 31 percentage points below Q2 FY26.
RIL said Northeast Asian crackers excluding China were affected by high naphtha costs, negative margins and rationalisation. China’s operating rate improved marginally to 79%, supported by naphtha availability, coal-based production and rising derivative exports. The 72% Asia-Pacific operating rate was therefore 18 percentage points below the United States, showing the regional effect of differing feedstock costs and supply-chain conditions.
Got a follow-up? Ask IRIS
How did supply disruption affect chemical margins and demand?
Supply disruption increased several downstream chemical margins in Q2 FY27, although demand volumes were mixed. PE and polypropylene, or PP, margins each averaged $340 per metric tonne, up 5% and 8% year on year, respectively. RIL linked higher product prices to limited regional supply and firm naphtha prices.
Polyvinyl chloride, or PVC, margin declined 19% year on year to $295 per metric tonne. RIL said PVC prices rose 13%, lagging a 57% increase in ethylene dichloride feedstock prices. By contrast, the polyester-chain margin increased 33% to $573 per metric tonne, supported by a 33% increase in paraxylene, a 15% increase in PTA and a 49% increase in polyester product deltas.
Indian polymer demand declined 4% year on year in Q2 FY27, including an 18% fall in PVC demand and a 3% fall in PP demand. PE demand increased 3%, while total polymer demand rose 18% quarter on quarter. RIL attributed the annual decline to constrained product availability from Middle East disruptions, whereas the sequential recovery reflected improved downstream activity.
Polyester demand fell 6% year on year but improved 10% quarter on quarter. Within the segment, polyethylene terephthalate demand rose 5%, while polyester filament yarn fell 10% and polyester staple fibre fell 5%. RIL said price volatility and cautious buying weighed on polyester demand, while delayed monsoon conditions increased beverage-sector demand for polyethylene terephthalate.
What is RIL doing to increase ethane sourcing?
RIL is adding very large ethane carriers, or VLECs, to increase ethane sourcing opportunities under its feedstock-flexibility plan. Management said one new vessel was operational and that a second vessel was received in October 2026. The stated priorities also include high asset utilisation and an optimised product mix aligned with domestic demand.
Management said domestic chemical demand was expected to be supported by inventory replenishment, the festive season, agriculture and infrastructure activity. It also identified textile and polyester export opportunities as India's free-trade agreements with key countries take effect. These expectations sit alongside a disclosed risk that new cracker capacity in China could maintain overcapacity in Asia.
The additional vessel capacity is relevant because RIL identifies ethane as the most competitive feedstock while Middle East naphtha flows remain constrained. Its strategy combines higher ethane sourcing with product-mix optimisation rather than relying only on market prices. The company also said it would seek to capture seasonal demand and strengthen its differentiated product portfolio and customer relationships.
Conclusion
RIL's disclosures show that disrupted naphtha flows, higher crude-linked naphtha prices and sharply higher freight changed relative cracker economics in Q2 FY27. Naphtha rose 43% year on year while US ethane rose 5%, producing a $557-per-metric-tonne differential. The effect was visible in regional utilisation, with US crackers at 90% and Asia-Pacific crackers at 72%.
The next factor to watch is execution of RIL's higher ethane-sourcing plan after receipt of the second VLEC in October 2026. Management also disclosed that Middle East naphtha flow remained about 6 MMT per quarter below pre-war levels and that Chinese cracker additions could sustain Asian overcapacity, both of which could influence regional margins and operating rates.