










Renaissance Global reports record Rs 280 crore operating cash flow
Key highlights
- Renaissance Global reported Rs 280 crore of TTM operating cash flow at September 2026, above the prior Rs 229 crore peak in FY23.
- H1 FY27 operating cash flow was a Rs 143 crore inflow versus an Rs 83 crore outflow in H1 FY26.
- Net working-capital days fell by 54 days year on year to 208 at September 2026.
- Net debt declined 42% year on year to Rs 199 crore at September 2026.
powered by IRIS
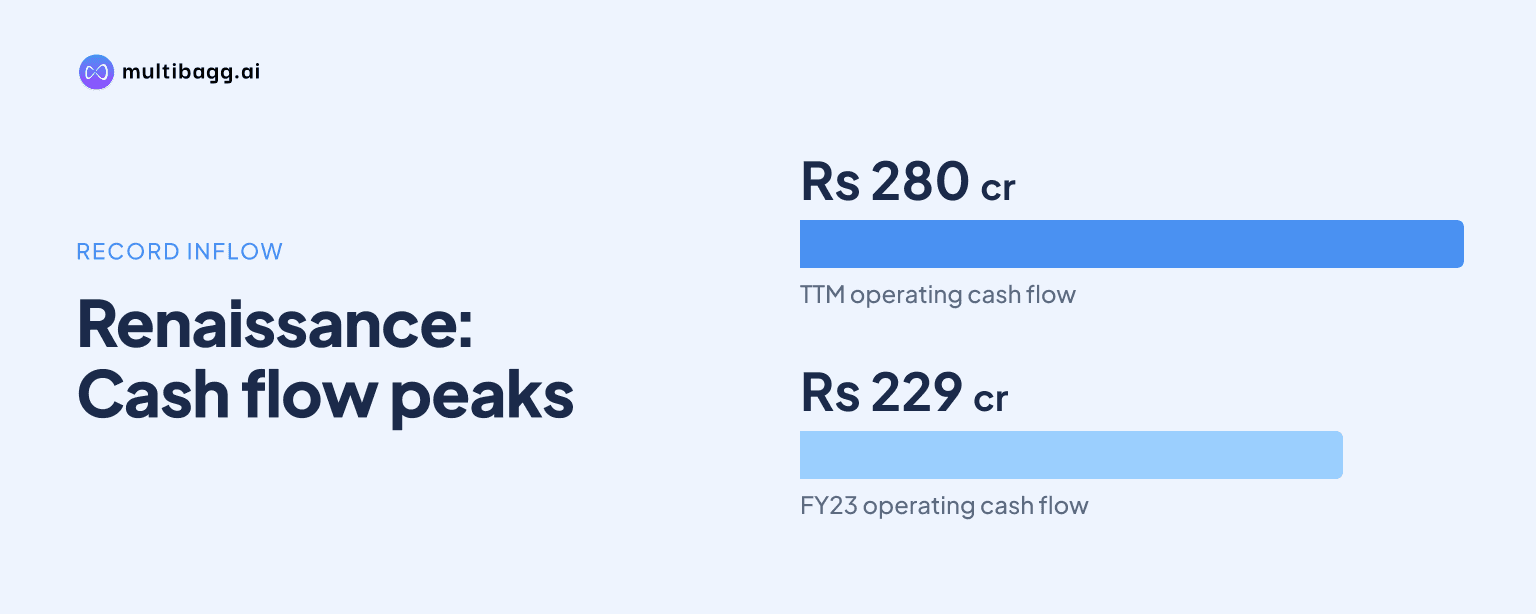
Renaissance Global reported record trailing 12-month net cash from operating activities of Rs 280 crore at September 2026, surpassing its previous Rs 229 crore peak in FY23 after H1 FY27 turned into a Rs 143 crore inflow from an Rs 83 crore outflow a year earlier.
Know Renaissance Global inside out
Results, valuation, peers and who's buying, in one view.
How did Renaissance Global reach its operating cash-flow record?
Renaissance Global reached its record with Rs 280 crore of net cash from operating activities in the trailing 12 months, or TTM, to September 2026. This was Rs 51 crore above the previous peak of Rs 229 crore in FY23 and Rs 226 crore above the Rs 54 crore reported for FY26.
The result followed a volatile cash-flow sequence. Operating cash flow was Rs 202 crore in FY20, Rs 117 crore in FY21 and Rs 86 crore in FY22 before rising to Rs 229 crore in FY23. It then moved to outflows of Rs 35 crore in FY24 and Rs 1 crore in FY25, before returning to a Rs 54 crore inflow in FY26.
The TTM figure is not a completed financial-year result. Renaissance Global states that it reports cash flow at half-year and year-end, and the TTM September 2026 result includes the Rs 143 crore operating inflow generated in H1 FY27.
What changed in Renaissance Global's H1 FY27 cash flow?
Renaissance Global’s H1 FY27 operating cash flow improved by Rs 226 crore year on year, changing from an Rs 83 crore outflow in H1 FY26 to a Rs 143 crore inflow. The presentation does not allocate the swing to individual cash-flow lines, but it presents working-capital efficiency data alongside the reversal.
H1 FY27 free cash flow was Rs 103 crore after Rs 24 crore of interest and Rs 17 crore of capital expenditure, or capex. For the TTM September 2026 period, free cash flow was Rs 204 crore after Rs 51 crore of interest and Rs 25 crore of capex.
Revenue also increased during H1 FY27. Total revenue rose 37.0% to Rs 1,474.7 crore from Rs 1,076.7 crore in H1 FY26, including bullion sales of Rs 145.5 crore compared with Rs 14.8 crore. Revenue excluding bullion increased 25.2% to Rs 1,329.2 crore.
Customer brands revenue rose 28.3% to Rs 1,039.1 crore in H1 FY27, while owned brands revenue increased 33.4% to Rs 171.7 crore. Licensed brands revenue declined 3.8% to Rs 118.4 crore, while total earnings before interest, tax, depreciation and amortisation, or EBITDA, excluding bullion increased to Rs 101.2 crore from Rs 84.0 crore; the corresponding margin declined to 7.6% from 7.9%.
Got a follow-up? Ask IRIS
How did working capital support Renaissance Global's cash generation?
Renaissance Global reduced net working-capital days by 54 days year on year, to 208 days at September 2026 from 262 days at September 2025. The measure also improved from 233 days at March 2026 and is calculated from period-end balances divided by trailing 12-month sales, multiplied by 365.
Receivable days fell by 21 days to 107, while inventory days declined by 32 days to 134. Receivables were Rs 830 crore, up 4% as sales rose 24%, and inventory was Rs 1,043 crore, Rs 7 crore below the prior-year level despite the 24% sales increase. Payable days remained unchanged at 33.
Renaissance Global says it achieved Rs 551 crore of incremental annual sales with Rs 22 crore less working capital. Management also estimates that applying the prior year’s 72% working-capital-to-sales ratio to the same sales increase would have required an additional Rs 417 crore of working capital.
These working-capital figures provide context for the shift from the Rs 83 crore H1 FY26 operating outflow to the Rs 143 crore H1 FY27 inflow. The presentation does not quantify the separate cash effect of lower receivable days, inventory days or unchanged supplier credit.
What do Renaissance Global's cash flows show about debt and expansion?
Renaissance Global reported net debt of Rs 199 crore at September 2026, down Rs 144 crore, or 42%, from Rs 343 crore at September 2025. Net debt was also lower than Rs 267 crore at March 2026 and Rs 317 crore at September 2023, while net debt to equity was about 0.12 times compared with 0.24 times a year earlier.
Gross debt was Rs 582 crore at September 2026, of which 91% was short-term trade finance. Cash, bank balances and investments rose Rs 160 crore year on year to Rs 383 crore, with investments increasing to Rs 275 crore from Rs 129 crore. Cash and balance cover of gross debt was 66%, compared with 39% a year earlier.
Management describes growth as financed entirely through internal accruals. The stated basis includes Rs 280 crore of TTM operating cash flow, Rs 204 crore of TTM free cash flow and the Rs 144 crore year-on-year reduction in net debt, although the presentation does not reconcile internal accruals to individual expansion projects.
Renaissance Global also discloses expansion of Jean Dousset’s United States boutique footprint across Los Angeles, Westfield Valley Fair, Soho in New York and Boston’s Newbury Street. Its presentation cites a 12-to-15-month boutique payback period and shows about 10 months in the first full year under assumptions of approximately US$0.9 million capital per boutique and US$1.1 million annual contribution.
Conclusion
Renaissance Global’s Rs 280 crore TTM operating cash-flow record follows a Rs 226 crore first-half reversal, alongside a 54-day year-on-year reduction in working-capital days and a Rs 144 crore fall in net debt. The reported improvement occurred as revenue excluding bullion rose 25.2% in H1 FY27 and receivable and inventory days both declined.
The next disclosures to watch are future half-year and year-end cash-flow results as Renaissance Global funds the stated Jean Dousset boutique expansion. Management’s 12-to-15-month boutique payback range and the September 2026 working-capital cycle of 208 days provide the disclosed markers for whether operating cash generation continues to cover interest, capex and expansion requirements.