










Renaissance Global frees cash as working-capital cycle falls 54 days
Key highlights
- Renaissance Global cut net working-capital days by 54 days to 208 in Sep-26.
- Renaissance Global added Rs 551 crore of annual sales with Rs 22 crore less working capital.
- Renaissance Global reported Rs 280 crore of trailing-twelve-month net cash from operating activities in Sep-26.
- Renaissance Global's net debt declined 42% year on year to Rs 199 crore in Sep-26.
powered by IRIS
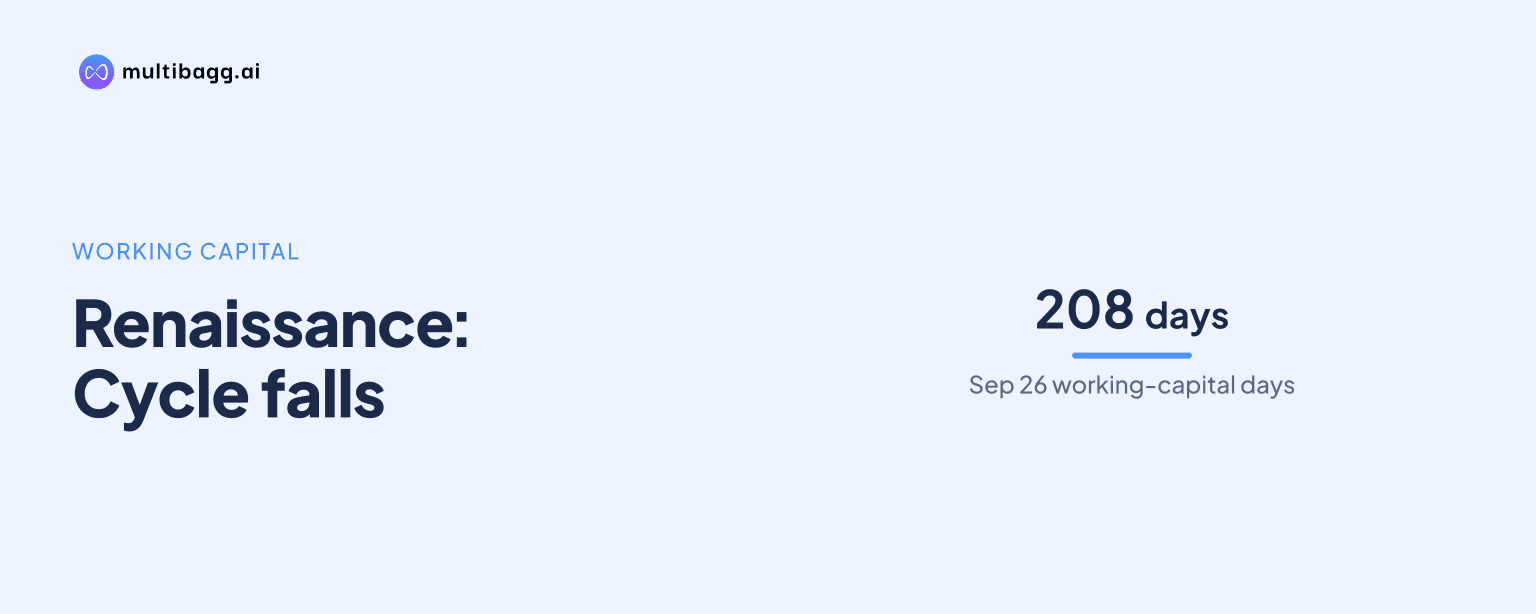
Renaissance Global reduced its net working-capital cycle by 54 days to 208 days in Sep-26, while adding Rs 551 crore of annual sales with Rs 22 crore less working capital. Lower receivable and inventory days drove the change, alongside Rs 280 crore of trailing-twelve-month net cash from operating activities.
Know Renaissance Global inside out
Results, valuation, peers and who's buying, in one view.
How did Renaissance Global cut its working-capital cycle by 54 days?
Renaissance Global reduced net working-capital days from 262 in Sep-25 to 208 in Sep-26, a 54-day year-on-year decline. The cycle had already fallen to 233 days in Mar-26, making the Sep-26 figure 25 days lower than the March reporting date. The presentation defines the measure as period-end balance divided by trailing-twelve-month sales, multiplied by 365.
The company reported Rs 551 crore of incremental annual sales with Rs 22 crore lower working capital. Renaissance Global said that, at its Sep-25 working-capital-to-sales ratio of 72%, the same sales growth would have required an additional Rs 417 crore of working capital. The comparison shows that the capital tied up in growth was lower than the prior-year sales relationship implied.
The 208-day result is a period-end measure, rather than an average balance across FY27. Its use of trailing-twelve-month sales reduces the influence of any single quarter's revenue level. Renaissance Global also states that payable days are shown as days of sales, which is relevant when reading the individual components of the cycle.
What drove Renaissance Global's lower working-capital days?
Renaissance Global's reduction in receivable and inventory days drove the 54-day improvement, while payable days were unchanged. Receivable days fell by 21 days, from 128 in Sep-25 to 107 in Sep-26. Receivables were Rs 830 crore in Sep-26, up 4% year on year while sales increased 24%.
Inventory days declined by 32 days, from 167 in Sep-25 to 134 in Sep-26. Inventory stood at Rs 1,043 crore in Sep-26, which was Rs 7 crore below the prior-year amount despite the 24% increase in sales. This means inventory did not increase in line with annual sales over the period shown.
Payable days remained at 33 in both Sep-25 and Sep-26, so a longer supplier-payment period did not contribute to the reported reduction. Renaissance Global states that supplier credit remained unchanged. The working-capital improvement was therefore concentrated in collections from customers and inventory management.
Got a follow-up? Ask IRIS
How did the working-capital change affect Renaissance Global's cash flow?
Renaissance Global reported Rs 280 crore of net cash from operating activities for the trailing twelve months to Sep-26, the highest amount in the series presented. That exceeded the previous peak of Rs 229 crore in FY23 by Rs 51 crore. It also compared with Rs 54 crore in FY26, although the latest amount covers a trailing twelve-month period rather than a financial year.
Trailing-twelve-month free cash flow was Rs 204 crore after Rs 51 crore of interest and Rs 25 crore of capital expenditure. The presentation identifies these interest and capital-expenditure amounts as the stated deductions from operating cash flow. Renaissance Global reports cash flow at half-year and year-end reporting dates, making the Sep-26 cash-flow measure a trailing-twelve-month figure.
The half-year comparison showed a Rs 226 crore year-on-year swing in cash from operations. Renaissance Global generated Rs 143 crore from operations in H1 FY27, compared with an Rs 83 crore outflow in H1 FY26. H1 FY27 free cash flow was Rs 103 crore after Rs 24 crore of interest and Rs 17 crore of capital expenditure.
What do Renaissance Global's debt and liquidity figures show?
Renaissance Global reported net debt of Rs 199 crore in Sep-26, down Rs 144 crore, or 42%, from Rs 343 crore in Sep-25. Net debt was also Rs 68 crore below the Rs 267 crore reported in Mar-26. The presentation describes the Sep-26 figure as its lowest net-debt level and shows net debt to equity at about 0.12 times, versus 0.24 times a year earlier.
Over the three years from Sep-23 to Sep-26, net debt decreased from Rs 317 crore to Rs 199 crore. Gross debt was Rs 582 crore in Sep-26, of which 91% was short-term trade finance. The gross-debt composition makes the cash, bank balances and investments balance relevant to the net-debt position.
Cash, bank balances and investments totalled Rs 383 crore in Sep-26, up Rs 160 crore, or 72%, from Rs 223 crore in Sep-25. Investments accounted for Rs 275 crore of the Sep-26 balance, compared with Rs 129 crore a year earlier. Renaissance Global reported that cash and investments covered 66% of gross debt in Sep-26, compared with 39% in Sep-25.
Conclusion
Renaissance Global's Sep-26 figures show that sales growth was accompanied by a smaller working-capital requirement: receivable days fell by 21, inventory days fell by 32, and payable days held at 33. The resulting 208-day cycle coincided with Rs 280 crore of trailing-twelve-month operating cash flow and net debt falling Rs 144 crore year on year to Rs 199 crore.
The next reporting updates should show whether the company maintains the 208-day cycle while its trailing-twelve-month sales continue to change. Renaissance Global discloses cash flow at half-year and year-end dates, so the next such disclosures will indicate whether operating cash flow and free cash flow continue to support growth through internal accruals.