










rentomojo grows subscribers 42.5% as occupancy rate rises
Key highlights
- rentomojo's live subscriber base rose 42.5% to 324,208 in H1FY27.
- Warehouse area increased 51.3% to 672,616 square feet while occupancy rose 91 basis points to 84.8%.
- rentomojo operated 24 warehouses across 33 major cities and 96 experience stores across 14 cities as at 30 September 2026.
- Revenue from operations grew 52.0% to Rs 268.44 crore, while H1FY27 capital expenditure rose 140.6% to Rs 192.30 crore.
powered by IRIS
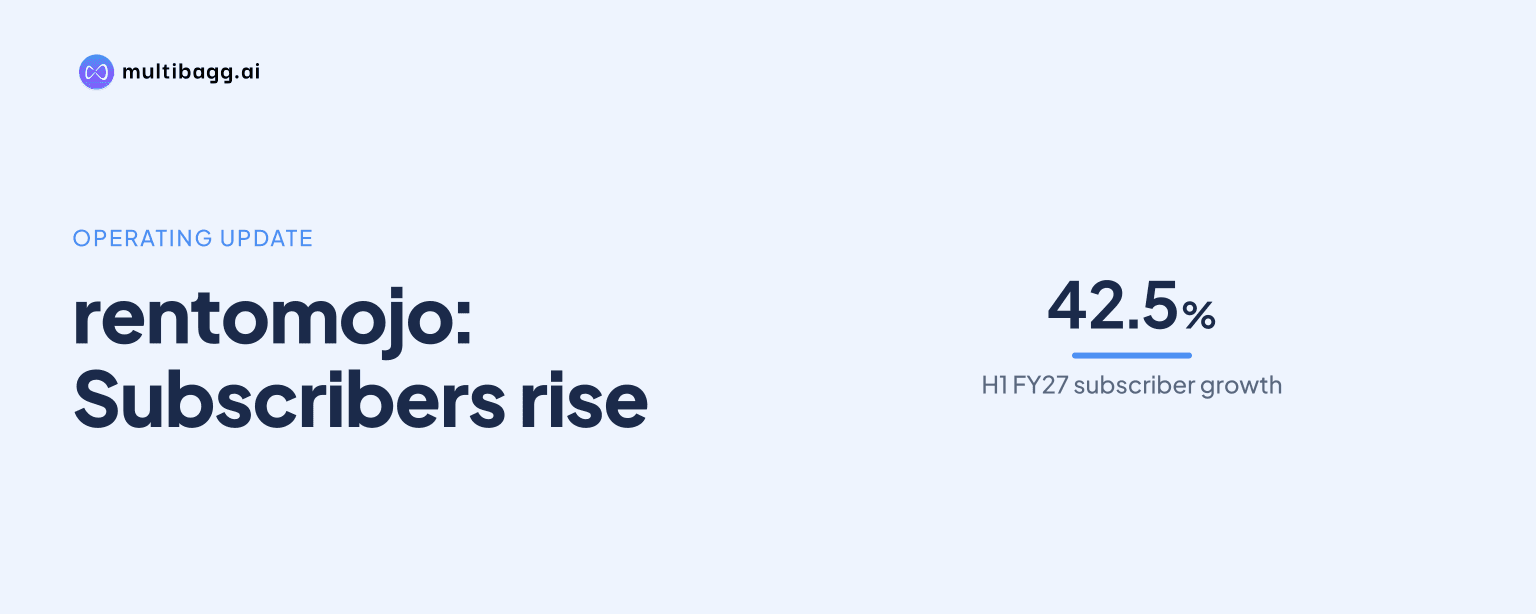
rentomojo increased live subscribers 42.5% year on year to 324,208 in H1FY27, while average occupancy rose 91 basis points to 84.8% despite warehouse area expanding 51.3% to 672,616 square feet. The figures cover the half year ended 30 September 2026 and show deployed-item utilisation increased alongside fleet and network growth.
Know Rentomojo inside out
Results, valuation, peers and who's buying, in one view.
How much did rentomojo's subscriber and item base grow in H1FY27?
rentomojo added 96,697 live subscribers year on year, taking its base from 227,511 in H1FY26 to 324,208 in H1FY27. Gross items ordered grew 45.4% over the same period, increasing from 488,715 to 710,506, which was a faster rate than subscriber growth.
Live items rose 44.0% to 1,049,419 in H1FY27 from 728,773 in H1FY26. Items per user remained at 2.8 in both periods, so the reported increase in the live-item base occurred without a change in the average reported number of items per user.
The 44.0% rise in live items was 1.5 percentage points above the 42.5% rise in subscribers, while items per user held at 2.8. rentomojo does not disclose subscriber additions by city, customer retention, or product-category demand in the H1FY27 operating data, so the drivers of the additions cannot be separated further.
How far did rentomojo expand warehouses and experience stores?
rentomojo expanded warehouse area by 51.3% to 672,616 square feet in H1FY27 from 444,486 square feet in H1FY26. That rate was 8.8 percentage points above subscriber growth of 42.5%, indicating that reported physical space increased faster than the active subscriber base during the half year.
Experience stores increased by 29, or 43.3%, to 96 in H1FY27 from 67 in H1FY26. As at 30 September 2026, rentomojo reported 24 warehouses servicing 33 major cities and 96 experience stores across 14 cities.
Delhi-NCR had five warehouses as at 30 September 2026, followed by Bengaluru with four and Kolkata with three. Bengaluru had 28 experience stores and Delhi-NCR had 24, meaning these two markets accounted for 52 of rentomojo's 96 stores; Mumbai had 11, Pune had 10 and Hyderabad had eight.
The source does not provide warehouse counts, cities served or city-level store counts for H1FY26. Therefore, while the 51.3% increase in total warehouse area and 43.3% increase in stores can be compared across periods, the geographic distribution of that expansion cannot be calculated from the disclosed data.
Did rentomojo improve occupancy while adding capacity?
rentomojo improved average occupancy to 84.8% in H1FY27 from 83.9% in H1FY26, an increase of 91 basis points. The company defines average occupancy as average items deployed with subscribers for the period divided by average live items for the period.
The occupancy increase coincided with live items rising 44.0% to 1,049,419 and warehouse area rising 51.3% to 672,616 square feet. This means rentomojo reported a greater share of its average live-item fleet deployed with subscribers even as the item base and physical network expanded.
Average revenue per item increased 5.9% to Rs 3,271 in H1FY27 from Rs 3,089 in H1FY26. Purchase displaced, a company-reported measure shown in the operating-driver table, rose 56.1% to Rs 86.05 crore from Rs 55.13 crore, although the presentation does not provide a definition of that measure beyond its label.
The presentation does not provide occupancy by city, warehouse, product category or month for the half year ended 30 September 2026. It also does not disclose the number of items held in warehouses rather than deployed, beyond the average occupancy calculation and the 1,049,419 reported live items.
Got a follow-up? Ask IRIS
How did operating expansion relate to rentomojo's financial results?
rentomojo reported revenue from operations of Rs 268.44 crore in H1FY27, up 52.0% from Rs 176.61 crore in H1FY26. Revenue growth exceeded the 42.5% increase in live subscribers and the 44.0% rise in live items, alongside the 5.9% increase in average revenue per item.
Normalised earnings before interest, tax, depreciation and amortisation, or EBITDA, increased 51.5% to Rs 111.10 crore from Rs 73.30 crore. The normalised EBITDA margin was 41.0% in both H1FY26 and H1FY27; rentomojo states that margins are calculated on total income and normalised figures are adjusted for exceptional items.
Normalised earnings before interest and tax, or EBIT, rose 50.7% to Rs 62.20 crore in H1FY27 from Rs 41.30 crore. Normalised profit after tax, or PAT, increased 61.0% to Rs 45.90 crore from Rs 28.50 crore, while reported net profit declined to Rs 26.02 crore from Rs 61.38 crore because H1FY26 included a Rs 32.84 crore deferred-tax credit and H1FY27 recorded a Rs 8.94 crore deferred-tax expense.
Capital expenditure on fleet and fit-out rose 140.6% to Rs 192.30 crore in H1FY27 from Rs 79.90 crore in H1FY26. Operating cash flow rose 36.7% to Rs 110.00 crore from Rs 80.50 crore, and gross fixed assets increased 32.6% from Rs 529.90 crore at FY26 to Rs 702.80 crore at H1FY27.
Conclusion
rentomojo's H1FY27 data show that its 42.5% subscriber increase was accompanied by a 44.0% increase in live items, 51.3% more warehouse area and 43.3% more experience stores. Average occupancy nevertheless increased to 84.8%, while revenue from operations rose 52.0% to Rs 268.44 crore and average revenue per item rose to Rs 3,271.
The next operating measures to watch are whether the Rs 192.30 crore of H1FY27 fleet-and-fit-out capital expenditure produces further growth in live items, occupancy and revenue per item. The presentation also leaves unresolved the economics by city and product category, as well as the distribution of subscriber growth across the 33 cities served by warehouses and 14 cities with experience stores.