










Repco Home Finance Limited cuts GNPA to 2.42% as coverage rises
Key highlights
- Repco Home Finance reported GNPA of 2.42% in September 2026, down from 3.16% in September 2025.
- Stage-3 coverage increased to 66.0% in September 2026 from 52.5% a year earlier.
- Pre-April 2022 loans had a 13.0% Stage-2 ratio, versus 4.3% for loans sanctioned from April 2022.
- Stage-1 AUM reached Rs 14,873 crore, or 90.5% of Rs 16,425 crore total AUM, in September 2026.
powered by IRIS
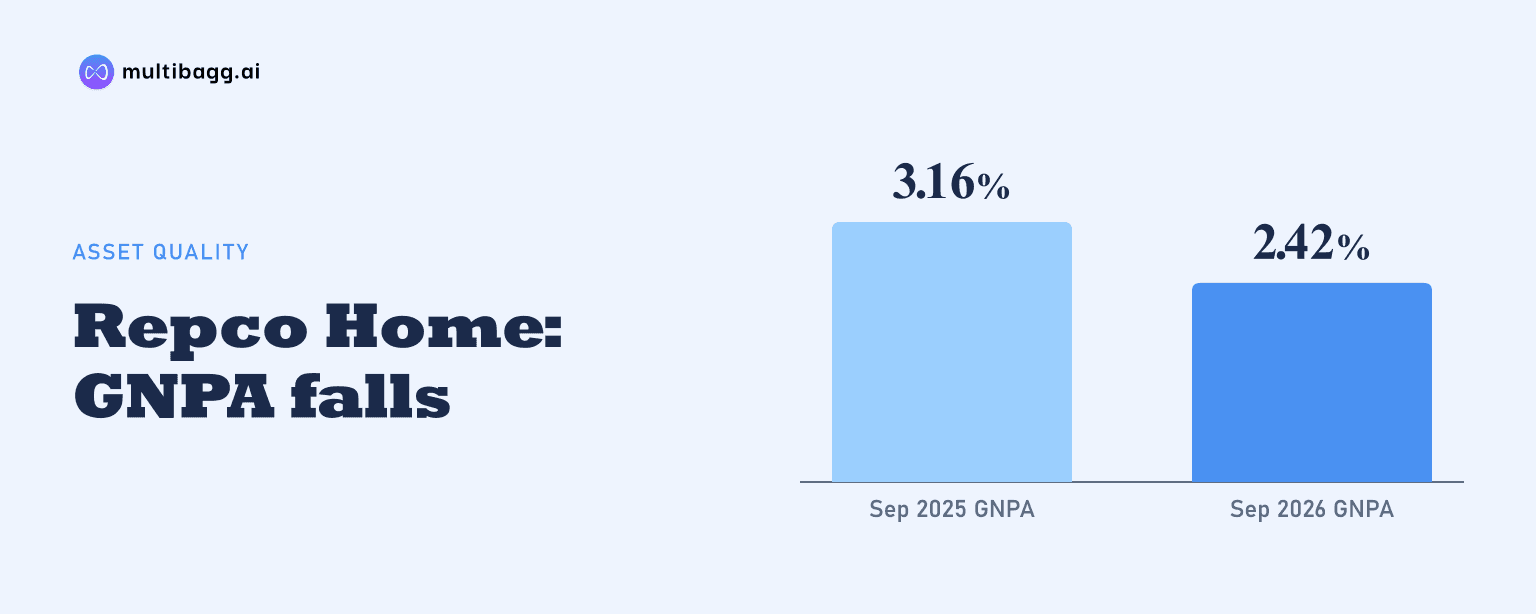
Repco Home Finance reduced gross non-performing assets to 2.42% in September 2026 from 3.16% a year earlier, while its Stage-3 expected-credit-loss coverage rose to 66.0% from 52.5%. Repco Home Finance’s remaining asset-quality concentration was in loans sanctioned by March 2022, which carried 13.0% Stage-2 and 5.5% Stage-3 ratios.
Know Repco Home Finance inside out
Results, valuation, peers and who's buying, in one view.
How far has Repco Home Finance reduced bad loans?
Repco Home Finance cut its gross non-performing asset, or GNPA, ratio by 74 basis points over the year to September 2026, reaching 2.42% from 3.16% in September 2025. Net non-performing assets, or NNPA, fell more sharply, by 67 basis points to 0.83% from 1.50%. A basis point is one-hundredth of a percentage point, and the difference between GNPA and NNPA reflects provisions against impaired loans.
The quarterly trajectory was not entirely linear. GNPA declined from 3.16% in September 2025 to 2.55% in March 2026, edged up to 2.67% in June 2026, then decreased to 2.42% in September 2026. NNPA followed the same broad direction, moving from 1.17% in March 2026 and 1.23% in June 2026 to 0.83% at September 2026. The September result was the lowest point in the five reported quarterly observations.
The company’s longer series shows the scale of the clean-up since FY22. GNPA was 7.0% in FY22, after which it fell to 5.80% in FY23, 4.10% in FY24, 3.26% in FY25 and 2.55% in FY26. At 2.42% in FY27 (6M), the ratio was 4.58 percentage points below the FY22 level. Repco Home Finance identifies a Reserve Bank of India, or RBI, circular on non-performing asset treatment alongside the historical GNPA chart.
What changed in Repco Home Finance’s Stage-3 provisions?
Repco Home Finance increased coverage on Stage-3 loans to 66.0% in September 2026, from 54.5% in June 2026 and 52.5% in September 2025. Expected credit loss, or ECL, provision specifically for Stage 3 was Rs 263 crore at September 2026, versus Rs 233 crore three months earlier and Rs 249 crore one year earlier. The higher provision was recorded even as the gross Stage-3 balance declined.
Gross Stage 3, measured as principal outstanding, was Rs 398 crore in September 2026, compared with Rs 427 crore in June 2026 and Rs 475 crore in September 2025. Net Stage 3 was Rs 135 crore, down from Rs 194 crore at June 2026 and Rs 225 crore at September 2025. Consequently, the share of the portfolio in Stage 3 fell to 2.4% from 2.7% sequentially and 3.2% year on year.
Total ECL provision was Rs 353 crore in September 2026, unchanged from June 2026 and lower than Rs 374 crore a year earlier. Gross Stage 1 and Stage 2 balances together increased to Rs 16,027 crore from Rs 15,564 crore in June 2026, and their portfolio share rose to 97.5% from 97.3%. The data indicate that the increased Stage-3 coverage was associated with a redistribution of the provision pool toward the smaller impaired-loan balance rather than a higher total ECL charge.
Which Repco Home Finance segments have the highest GNPA ratios?
Repco Home Finance reported lower GNPA ratios in both product categories during Q2FY27. Home-loan GNPA was 2.4%, down from 3.2% in Q2FY26 and 2.7% in Q1FY27. Home-equity GNPA reached 2.3%, compared with 3.1% a year earlier and 2.5% in the preceding quarter. Overall GNPA was 2.4% in Q2FY27, compared with 3.2% and 2.6% in those respective periods.
The occupation split showed a wider difference. The salaried segment’s GNPA ratio fell to 1.4% in Q2FY27 from 1.8% in Q2FY26, while the non-salaried segment declined to 3.2% from 4.4%. Despite the improvement, non-salaried GNPA remained 1.8 percentage points above the salaried ratio in Q2FY27. Both segments had recorded lower ratios than a year earlier, but their relative gap remained visible in the presentation.
Credit cost was 0.1% in FY27 (6M), following negative credit cost of 0.2% in FY26 and 0.3% in FY25. The measure had been 1.9% in FY22 and 0.4% in FY23, while FY24 was reported at 0.0%. Repco Home Finance’s presentation reports the ratio but does not state a future credit-cost target or explain the drivers of the FY27 (6M) change.
Got a follow-up? Ask IRIS
Why do pre-April 2022 Repco Home Finance loans remain the key overdue pool?
Loans sanctioned by March 2022 represented Rs 4,986 crore of total assets under management, or AUM, at September 2026, but accounted for Rs 645 crore of Stage-2 AUM and Rs 275 crore of Stage-3 AUM. Their Stage-2 ratio was 13.0% and their Stage-3 ratio was 5.5%. Repco Home Finance categorises these vintages by sanction date, rather than by disbursement or delinquency date.
Loans sanctioned from April 2022 totalled Rs 11,439 crore, more than twice the older-vintage AUM, yet had Rs 508 crore of Stage 2 and Rs 129 crore of Stage 3. Their Stage-2 ratio was 4.3%, while Stage 3 was 1.1%. The older cohort’s Stage-2 ratio was therefore 8.7 percentage points higher, and its Stage-3 ratio 4.4 percentage points higher, than the post-April 2022 cohort.
The breakup also shows the concentration in absolute balances. Pre-April 2022 loans represented about 30% of Rs 16,425 crore total AUM, but represented Rs 645 crore of the Rs 1,153 crore Stage-2 total and Rs 275 crore of the Rs 404 crore Stage-3 total shown in the vintage table. The Stage-3 total differs from the Rs 398 crore balance in the ECL table; both pages state amounts are rounded, with the stage-movement page also explicitly saying amounts are rounded to the nearest crore.
How did Repco Home Finance’s stage mix change as AUM grew?
Repco Home Finance’s AUM increased to Rs 16,425 crore in September 2026 from Rs 15,033 crore in September 2025, an increase of Rs 1,392 crore. Stage 1 increased by Rs 1,639 crore to Rs 14,873 crore, and its portfolio share rose to 90.5% from 88.03%. This shift in mix accompanied the decline in the reported Stage-3 share to 2.4% from 3.1%.
Stage 2 decreased to Rs 1,154 crore in September 2026 from Rs 1,324 crore a year earlier, reducing its portfolio share from 8.8% to 7.0%. It was broadly unchanged from Rs 1,152 crore in June 2026, although the percentage declined from 7.2% because total AUM rose. Stage 3 fell by Rs 77 crore over the year to Rs 398 crore, while its share reduced by 0.7 percentage points.
The movement between June and September 2026 was led by Stage 1, which grew by Rs 462 crore, while total AUM rose by Rs 435 crore. Stage 2 added Rs 2 crore and Stage 3 declined by Rs 29 crore in the same interval. These figures describe the balance distribution at the reported dates; the presentation does not provide migration, cure, write-off or recovery flows that would explain each stage movement.
Conclusion
Repco Home Finance reported lower GNPA, NNPA and Stage-3 balances by September 2026, alongside a rise in Stage-3 coverage to 66.0%. The improvement extended across home loans, home equity, salaried borrowers and non-salaried borrowers, while the portfolio mix moved toward Stage 1 as AUM reached Rs 16,425 crore.
The next reported periods will show whether older sanctioned loans continue to shrink as a source of stress. At September 2026, loans sanctioned by March 2022 still had 13.0% Stage 2 and 5.5% Stage 3, compared with 4.3% and 1.1%, respectively, for loans sanctioned from April 2022, leaving vintage performance as the disclosed unresolved asset-quality distinction.