










Repco Home Finance spread rises while Q2 ROE slips to 12.6%
Key highlights
- Repco Home Finance reported a 3.7% spread in Q2FY27, versus 3.4% in Q2FY26 and Q1FY27.
- Repco Home Finance's cost-to-income ratio increased to 29.7% in Q2FY27 from 26.0% in Q1FY27.
- Repco Home Finance's Q2FY27 net profit rose 8.4% year on year to Rs 116 crore.
- Repco Home Finance's GNPA declined to 2.42% in September 2026 from 3.16% in September 2025.
powered by IRIS
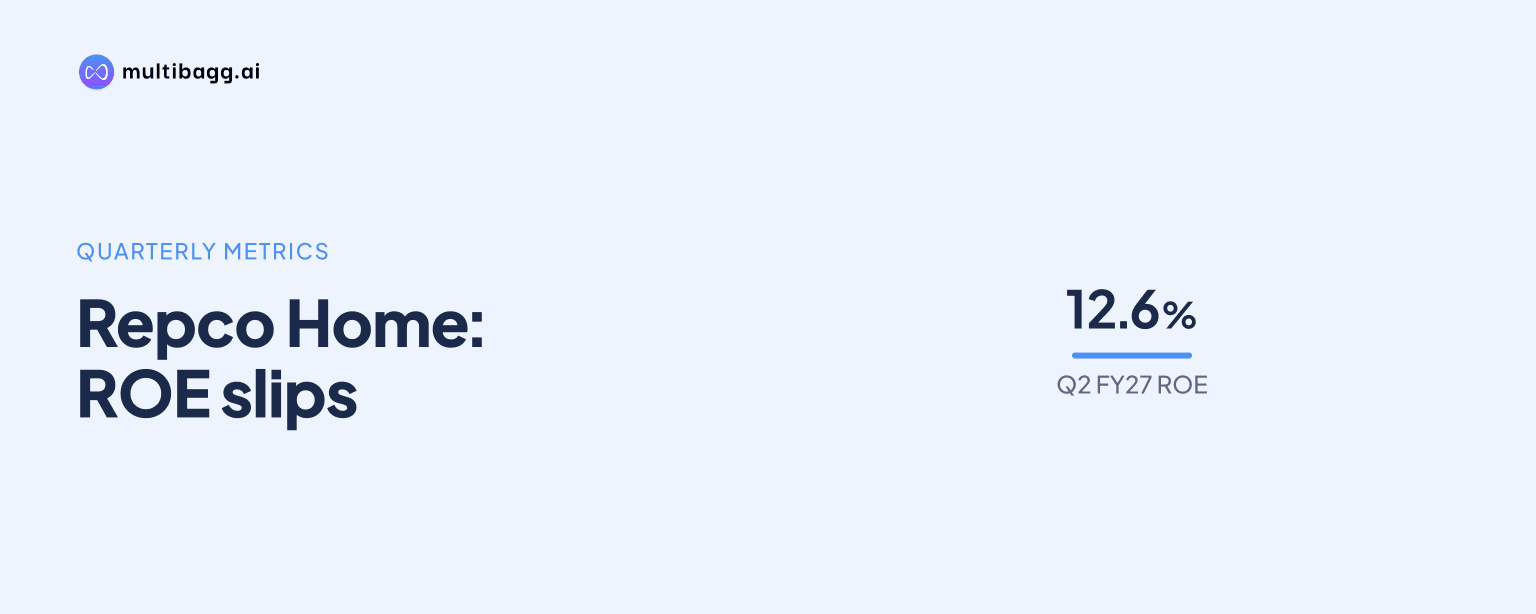
Repco Home Finance Limited reported a 3.7% spread in Q2FY27, up from 3.4% in Q2FY26 and Q1FY27, but its cost-to-income ratio rose to 29.7% and return on equity fell to 12.6%. Net profit nevertheless increased 8.4% year on year to Rs 116 crore from Rs 107 crore.
Know Repco Home Finance inside out
Results, valuation, peers and who's buying, in one view.
Why did Repco Home Finance's profitability ratios move in different directions?
Repco Home Finance's net interest margin and spread improved in Q2FY27, while return on equity declined. Net interest margin rose to 5.5% from 5.4% in Q2FY26 and Q1FY27, while spread increased by 0.3 percentage point to 3.7% from 3.4% in both earlier quarters.
Return on equity, or ROE, fell from 13.5% in Q2FY26 to 12.7% in Q1FY27 and 12.6% in Q2FY27. Return on assets, or ROA, remained at 2.9% in all three reported quarters, so the reported decline in ROE occurred without a change in ROA.
How much did Repco Home Finance's operating costs rise in Q2FY27?
Repco Home Finance's employee cost increased to Rs 39 crore in Q2FY27 from Rs 34 crore in Q2FY26 and Q1FY27. Other operating expenses, or OPEX, reached Rs 31 crore, compared with Rs 26 crore a year earlier and Rs 25 crore in the preceding quarter.
The cost-to-income ratio rose to 29.7% from 28.4% in Q2FY26 and 26.0% in Q1FY27. Income from operations still increased to Rs 481 crore from Rs 445 crore year on year and Rs 468 crore sequentially, but the presentation does not provide a separate explanation for the increase in the quarterly ratio.
Did Repco Home Finance convert higher income into higher profit?
Repco Home Finance recorded higher income and profit in Q2FY27, although profit before tax, or PBT, grew more slowly than operating revenue. Income from operations rose 8.0% year on year to Rs 481 crore, net interest income increased 10.0% to Rs 220 crore, and PBT rose 5.0% to Rs 149 crore.
Net profit increased 8.4% year on year to Rs 116 crore from Rs 107 crore. Compared with Q1FY27, net interest income rose 1.8% from Rs 216 crore, operating revenue increased 2.7% from Rs 468 crore, PBT rose 0.6% from Rs 148 crore, and net profit increased 1.7% from Rs 114 crore.
Business volumes grew faster sequentially than income. Sanctions increased 44.8% to Rs 1,359 crore from Rs 938 crore in Q1FY27, while disbursements rose 43.0% to Rs 1,205 crore from Rs 843 crore. Against Q2FY26, sanctions and disbursements were each 12.7% higher.
Got a follow-up? Ask IRIS
What do Repco Home Finance's six-month figures show?
Repco Home Finance's cost-to-income ratio for the six months ended September 2026 was 27.8%, compared with 26.3% in September 2025. Employee cost increased to Rs 73 crore from Rs 62 crore and other OPEX rose to Rs 56 crore from Rs 51 crore.
Six-month income from operations increased to Rs 949 crore from Rs 885 crore, while net interest income rose to Rs 436 crore from Rs 397 crore. Net profit reached Rs 230 crore, compared with Rs 215 crore in the corresponding six-month period of September 2025.
The half-year ratio trends differed from the Q2 movement in one respect. Net interest margin was unchanged at 5.4%, while spread increased to 3.5% from 3.3%; ROE declined to 12.5% from 13.6%, and ROA remained at 2.9%.
How do Repco Home Finance's loan book and asset quality compare?
Repco Home Finance's loan book reached Rs 16,425 crore in September 2026, up from Rs 15,990 crore in June 2026 and Rs 15,033 crore in September 2025. Net owned fund increased to Rs 3,875 crore from Rs 3,768 crore in June 2026 and Rs 3,464 crore a year earlier.
Non-salaried borrowers accounted for 53.6% of the September 2026 loan book, compared with 46.4% for salaried borrowers. Home loans represented 71.0% of the portfolio and home equity represented 29.0%, unchanged from the September 2025 product mix.
Gross non-performing assets, or GNPA, declined to 2.42% in September 2026 from 2.67% in June 2026 and 3.16% in September 2025. Net non-performing assets, or NNPA, declined to 0.83% from 1.23% and 1.50%, respectively, while credit cost was 0.1% for FY27 (6M), following negative 0.2% in FY26.
Conclusion
Repco Home Finance combined a higher Q2FY27 spread of 3.7%, a 5.5% net interest margin and an 8.4% increase in net profit with a higher cost-to-income ratio of 29.7%. The comparison shows that improved revenue and volume measures did not prevent ROE from declining to 12.6% from 13.5% a year earlier.
The presentation does not disclose a separate reason for the rise in the cost-to-income ratio from 26.0% in Q1FY27. The next disclosures will indicate whether employee cost, which reached Rs 39 crore, and other OPEX, which reached Rs 31 crore, remain elevated and whether ROE moves from 12.6%.