










Rubicon Research reports 8% US generics unit-price rise
Key highlights
- Rubicon reported an 8.0% average US generics unit-price increase from FY22 to FY25, against 5.2% industry-average erosion.
- Metoprolol Tartrate volume market share rose to 48.0% in FY26 from 37.3% in FY25.
- Carbidopa Levodopa reached first rank in FY26 with 24.6% volume market share, up from 18.7%.
- Rubicon said 84% of all approved products have been commercialised.
powered by IRIS
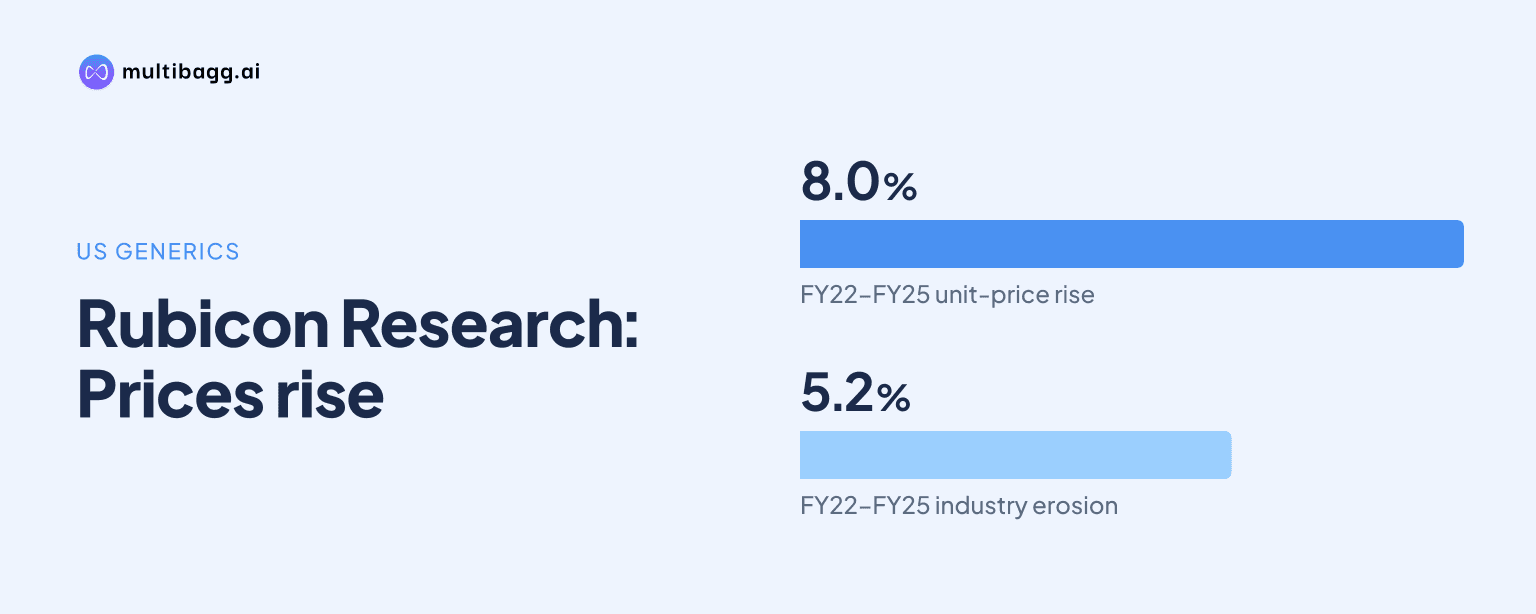
Rubicon Research reported that its US generics portfolio achieved an average unit-price increase of 8.0% from FY22 to FY25, compared with industry-average erosion of 5.2% over the same period. Rubicon presented this pricing outcome alongside FY26 volume-market-share leadership or rank improvements across six mature generic products.
Know Rubicon Research inside out
Results, valuation, peers and who's buying, in one view.
Why did Rubicon report price gains while US generics eroded?
Rubicon attributes its 8.0% FY22-FY25 average unit-price increase to a portfolio-selection process that combines scientific and economic criteria. Its development-pipeline screen includes demand trends, patient demographics, competitive conditions, technical and intellectual-property feasibility, unit economics and supply-chain risk, followed by prioritisation and ongoing reassessment.
The presentation describes this approach as a proprietary algorithm, but it does not disclose the calculation, product weightings or individual medicine-level contribution behind the 8.0% portfolio result. Rubicon’s reported outcome was 13.2 percentage points above the industry average of negative 5.2% during FY22-FY25.
The disclosed comparison is a portfolio-level unit-price measure rather than a reported change in revenue, gross profit or realised price for individual products. As a result, the presentation does not separate the effect of product mix, volumes, rebates or specific product pricing on the FY22-FY25 result.
How did Rubicon’s portfolio pricing compare by therapy area?
Rubicon’s 8.0% portfolio unit-price increase was below the 11.2% cardiovascular figure and the 21.8% oncology figure, but above the 1.3% alimentary tract and metabolism reading. The presentation labels the data as US generics price erosion by therapy area and cites Frost & Sullivan for the comparison.
Oncology recorded the highest stated change at 21.8%, while the nervous-system category was nearly flat at negative 0.1%. The 26.9-percentage-point spread between those two therapy-area figures shows that the industry-average decline of 5.2% was not uniform across categories in FY22-FY25.
Rubicon’s 8.0% outcome exceeded the alimentary tract and metabolism figure by 6.7 percentage points and the nervous-system figure by 8.1 percentage points. However, the presentation does not provide Rubicon’s therapy-area revenue mix, so it does not establish which category contributed most to the overall portfolio price increase.
Got a follow-up? Ask IRIS
How did Rubicon build volume market share in mature generics?
Rubicon reported first-ranked FY26 volume market share in all six cited products, with Carbidopa Levodopa and Lidocaine Hydrochloride advancing to first rank from third and second rank, respectively, in FY25. The company uses volume market share because it says value data do not reflect company-specific rebates.
The FY25-to-FY26 movement was mixed rather than uniformly positive. Metoprolol Tartrate gained 10.7 percentage points to 48.0%, Carbidopa Levodopa gained 5.9 points to 24.6%, and Diclofenac Potassium gained 3.0 points to 32.6%.
Baclofen declined 1.4 percentage points to 33.9% but retained first rank, while Lidocaine Hydrochloride fell 3.7 points to 35.1% and nevertheless moved from second to first rank. Rubicon defines competitors as marketing companies with more than 1% volume market share; competitor counts in FY26 ranged from three for Diclofenac Potassium and Lidocaine Hydrochloride to eight for Baclofen.
What does commercialisation show about Rubicon’s portfolio execution?
Rubicon said 84% of all approved products have been commercialised, linking its product-selection approach to market launch activity. The figure means more than four-fifths of approvals had reached commercialisation, although the presentation does not state the number of approved products or the number launched.
The six cited market-share examples span cardiovascular, central nervous system, analgesics and anaesthesia products, with launch years from FY19 for Cyclobenzaprine Hydrochloride to FY24 for Lidocaine Hydrochloride. Rubicon characterises these as mature, competitive products where it built leading positions despite being a late entrant.
Competitive conditions differed materially between products. Metoprolol Tartrate had six competitors at launch in FY20 and four in FY26, while Baclofen had seven at launch in FY20 and eight in FY26; Carbidopa Levodopa had five competitors at launch in FY23 and four in FY26.
The commercialisation disclosure does not identify why the remaining 16% of approved products had not been commercialised, whether they await supply or launch activity, or their likely revenue contribution. It therefore supports a measure of conversion from approvals to commercialisation, but not a product-level assessment of the pricing result reported for FY22-FY25.
Conclusion
Rubicon’s central disclosure is that its US generics portfolio recorded an 8.0% average unit-price increase from FY22 to FY25 while the industry average recorded 5.2% erosion. Its FY26 examples provide evidence of market-share execution, with all six products holding first rank, although Baclofen and Lidocaine Hydrochloride reported lower volume shares than in FY25.
The next disclosed execution point to watch is commercialisation, as Rubicon reported that 84% of approved products have been commercialised without identifying the timing, status or reason for the remaining 16%. Investors can also monitor whether the FY26 gains in Metoprolol Tartrate and Carbidopa Levodopa are sustained and whether the two products with lower FY26 shares regain volume.