










RUPA FY26 Revenue Beat FY23-FY25, Margins Stayed Below FY22
Key highlights
- RUPA's FY26 revenue was Rs 1,259 crore, Rs 20 crore above FY25 but Rs 216 crore below FY22.
- FY26 EBITDA was Rs 115 crore and the EBITDA margin was 9.2%, versus Rs 269 crore and 18.2% in FY22.
- FY26 PAT was Rs 73 crore, including Rs 5.6 crore of exceptional expenses for the full year.
- RUPA's FY26 debtor days reached 158, up 11 days from FY25 and 45 days from FY22.
powered by IRIS
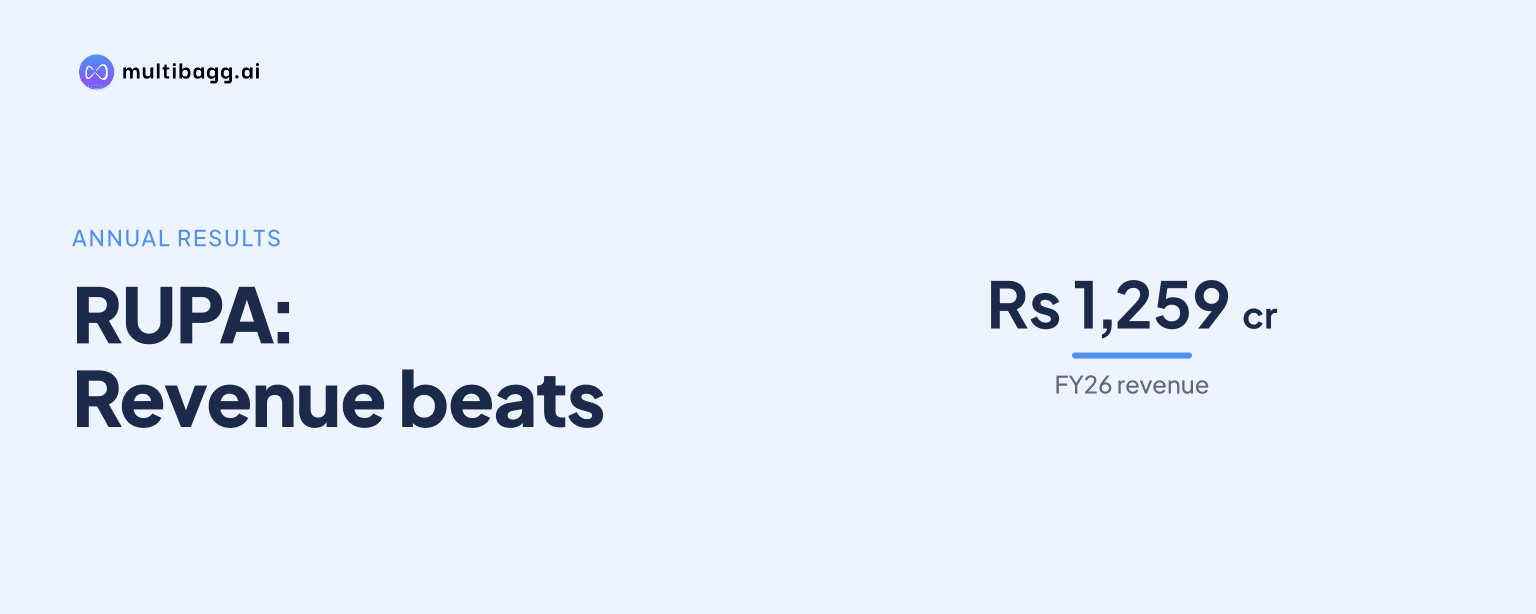
Rupa & Company Limited reported FY26 revenue of Rs 1,259 crore, exceeding FY23, FY24 and FY25, but its EBITDA margin of 9.2% remained 9.0 percentage points below FY22's 18.2%. FY26 profit after tax was Rs 73 crore against Rs 192 crore in FY22, and included Rs 5.6 crore of exceptional expenses.
Know Rupa & Company inside out
Results, valuation, peers and who's buying, in one view.
How did RUPA's FY26 revenue compare with earlier years?
RUPA's FY26 revenue of Rs 1,259 crore was its highest reported figure since FY22, rising Rs 20 crore from FY25, Rs 42 crore from FY24 and Rs 116 crore from FY23. It nevertheless remained Rs 216 crore below FY22 revenue of Rs 1,475 crore. Sales therefore exceeded each of the three years after FY22 without returning to the FY22 level.
The second half contributed Rs 755 crore of FY26 revenue, compared with Rs 504 crore in the first half. H2 revenue increased Rs 23 crore from Rs 732 crore in H2 FY25, while H1 revenue declined Rs 3 crore from Rs 507 crore in H1 FY25. Both periods remained below FY22, when H2 revenue was Rs 889 crore and H1 revenue was Rs 586 crore.
Why were RUPA's FY26 profits lower than FY22 despite sales exceeding FY23-FY25?
RUPA's earnings before interest, tax, depreciation and amortisation, or EBITDA, declined to Rs 115 crore in FY26 from Rs 130 crore in FY25 and Rs 269 crore in FY22. Revenue rose Rs 20 crore year on year, but EBITDA fell Rs 15 crore, reducing the EBITDA margin to 9.2% from 10.5% in FY25. The FY26 margin was also below FY24's 9.6%, though above FY23's 7.8%.
Profit after tax, or PAT, was Rs 73 crore in FY26, down Rs 10 crore from Rs 83 crore in FY25 and Rs 119 crore from Rs 192 crore in FY22. PAT margin was 5.8%, against 6.7% in FY25 and 13.0% in FY22. The presentation identifies exceptional expenses of Rs 2.9 crore in Q4 FY26 and Rs 5.6 crore for the full year, but does not provide adjusted PAT or an adjusted margin.
The half-year figures show that the year-on-year decline was more pronounced in H1. H1 EBITDA fell to Rs 35 crore from Rs 46 crore in H1 FY25, while H2 EBITDA fell to Rs 80 crore from Rs 84 crore. H1 PAT declined to Rs 20 crore from Rs 28 crore, whereas H2 PAT decreased to Rs 53 crore from Rs 55 crore, leaving H2 responsible for most of FY26 PAT.
Got a follow-up? Ask IRIS
How far have RUPA's return ratios recovered from FY22?
RUPA's return on capital employed, or ROCE, was 12.2% in FY26, below 13.7% in FY25 and 28.4% in FY22. Return on equity, or ROE, was 7.0%, compared with 8.4% in FY25 and 23.8% in FY22. Both ratios remained above FY23 levels of 8.5% for ROCE and 6.0% for ROE.
FY26 operating and net margins both moved lower from FY25, alongside the declines in EBITDA and PAT. EBITDA margin decreased 1.3 percentage points and PAT margin decreased 0.9 percentage points. Relative to FY22, FY26 ROCE was lower by 16.2 percentage points and ROE by 16.8 percentage points, while EBITDA and PAT were Rs 154 crore and Rs 119 crore lower, respectively.
What changed in RUPA's working-capital days in FY26?
RUPA reported 129 inventory days, 158 debtor days and 46 creditor days in FY26. Compared with FY25, inventory days increased by one day, creditor days increased by two days and debtor days increased by 11 days from 147. Debtor days were the highest in the five-year series, one day above the previous high of 157 days in FY23.
FY26 also differed from FY22, when inventory was 120 days, debtors were 113 days and creditors were 47 days. Inventory days were therefore nine days higher and debtor days 45 days higher than FY22, while creditor days were one day lower. The presentation lists the three components but does not state a total cash-conversion-cycle measure.
The trend after FY23 was uneven across the components. Inventory days declined from 171 in FY23 to 136 in FY24 and 128 in FY25, before increasing to 129 in FY26. Debtor days fell from 157 in FY23 to 138 in FY24, then rose to 147 in FY25 and 158 in FY26; creditor days moved from 56 to 42, 44 and 46 over the same four years.
Conclusion
RUPA's five-year data show a revenue rebuild after the FY23 low of Rs 1,143 crore, with FY26 sales ahead of the subsequent two years as well. However, the improvement in sales has not been matched by a return to the FY22 profitability or return-ratio levels: FY26 ROCE was 12.2% and ROE was 7.0%, compared with 28.4% and 23.8% in FY22.
The next reported financial results will show whether RUPA can reverse the FY26 declines in EBITDA and PAT while addressing debtor days of 158. The presentation leaves unresolved how much the Rs 5.6 crore full-year exceptional expense affected underlying FY26 profitability because it does not disclose an adjusted PAT or margin.