










S D Retail targets exclusive outlets for half of revenue
Key highlights
- S D Retail’s EBO revenue contribution rose to 35.8% in H1 FY27 from 25.36%.
- S D Retail’s EBO network reached 84 stores in H1 2026-27, up from 64 a year earlier.
- Like-to-like S D Retail stores generated annualised sales of Rs 21,266 per square foot, versus Rs 14,559 at other stores.
- S D Retail said MBO sales declined 10% in H1 FY27, while marketing spending rose to about Rs 2.70 crore from Rs 1 crore.
powered by IRIS
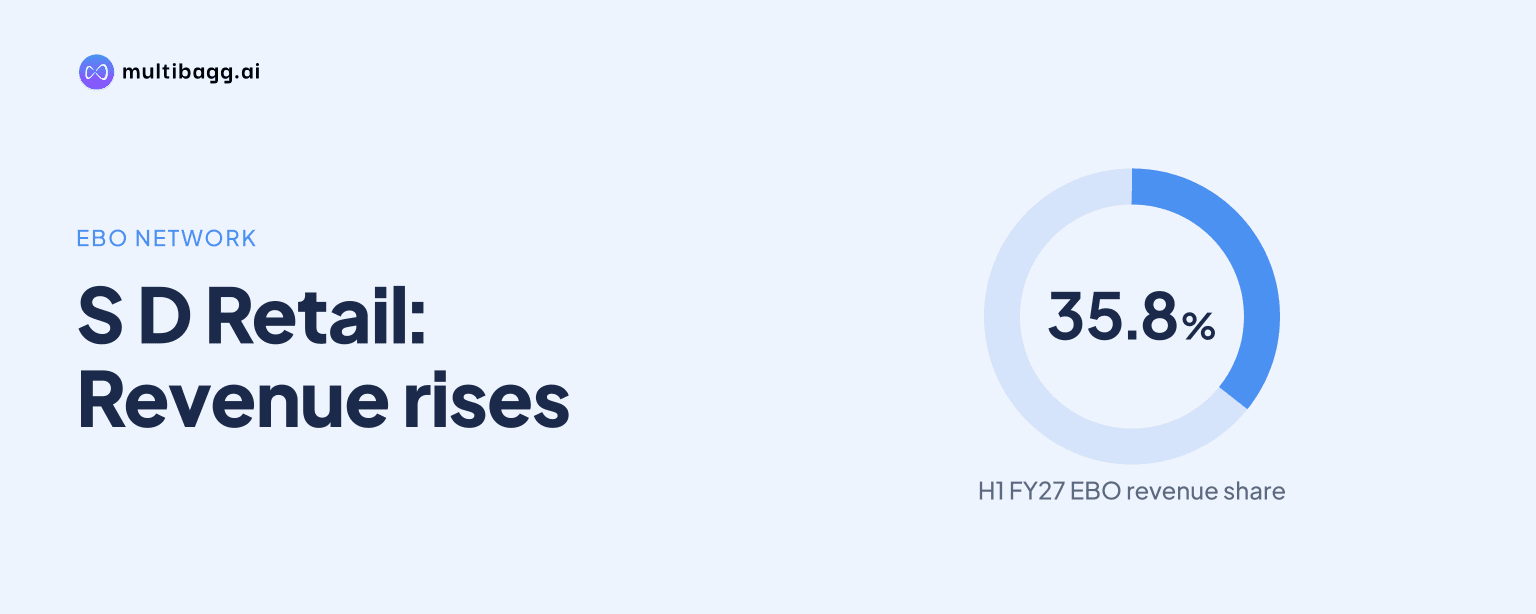
S D Retail Limited said exclusive brand outlets accounted for 35.8% of revenue in H1 FY27, up from 25.36%, and management’s first channel-mix goal is for those outlets to generate 50% of revenue. The shift coincided with a 10% H1 decline in multi-brand outlet sales, while the exclusive network reached 84 stores.
Know S D Retail inside out
Results, valuation, peers and who's buying, in one view.
Why is S D Retail increasing its exclusive-outlet revenue mix?
S D Retail is increasing the mix because management has set 50% of revenue from exclusive brand outlets, or EBOs, as its first goal. EBO contribution rose to 35.8% in H1 FY27 from 25.36%, according to management, as the company expanded its exclusive-store presence. Management did not provide a timetable for achieving the 50% level.
The store base has expanded since the EBO format began in 2022. Management reported 34 stores in H1 2024-25, 64 in H1 2025-26 and 84 in H1 2026-27. It views the EBO network as a channel through which it can shape assortment, in-store presentation and customer engagement, rather than relying only on multi-brand outlets, or MBOs.
Management also said an EBO opening and an MBO presence are complementary rather than competitive. Its view is that a new store raises consumer awareness of the category and brand, with a positive outcome at MBOs. That assertion matters because the mix target involves a larger EBO contribution, not a stated plan to eliminate the MBO channel.
How much more productive are S D Retail’s mature outlets?
S D Retail reported annualised sales of Rs 21,266 per square foot at like-to-like stores open for one year or more, compared with Rs 14,559 per square foot at other stores. The Rs 6,707-per-square-foot difference shows why management emphasises store maturity: older outlets produced sales about 46% above the newer-store group, while the blended network average was Rs 17,647 per square foot.
Management’s aim is for a new outlet to break even in its first season, although it said most stores are in the green after one year of operation. The company closed six stores in H1 FY27 where it did not see a likelihood of profitability, indicating that the expanding 84-store network is also being reviewed for individual-store performance.
The spread within the network remains wide. Management put monthly sales for the bottom 10% of EBOs at Rs 3 lakh and for the top 10% at Rs 20 lakh. That Rs 17 lakh monthly gap means network expansion alone will not determine the channel’s outcome; the pace at which newer stores approach mature-store sales and the handling of underperforming locations will also matter.
What is S D Retail doing to support sales at its own stores?
S D Retail said its refreshed brand identity had been rolled out at more than 50% of locations, and management linked the related visual-merchandising efforts to about 20% same-store sales growth, or SSSG, in H1 FY27. All new stores, visual merchandising and websites carry the identity, while older locations are being changed gradually because the programme requires capital expenditure.
The company has created a national visual-merchandising team at its corporate office, with regional visual-merchandising staff in major regions. It has also installed Tango Eye, a tool that records measures from a customer’s store entry through dwell time, engagement and the zones visited. Management said the analysis is being used by its team, but it did not disclose a separate conversion-rate or footfall figure from the tool.
Marketing spending rose from Rs 1 crore to about Rs 2.70 crore in H1 FY27, according to management, to build brand awareness and promote the website. Management also said it wants first-half profitability to increasingly resemble the second half over the next couple of years, rather than depend as heavily on the latter period. This is an operational objective, not financial guidance for a particular profit margin.
Got a follow-up? Ask IRIS
What does the EBO push mean for S D Retail’s MBO business?
S D Retail’s MBO business declined 10% in H1 FY27, but management said it expects that annualised decline to be recovered. It also said MBO contribution to total revenue will decline as the EBO network grows, while MBO sales value should not decline on an annualised basis. The distinction is central to the strategy: a falling share of sales does not necessarily mean fewer rupees of MBO sales.
The temporary H1 decline came as EBO contribution climbed from about 25% to about 36%, while the company increased the outlet base to 84. Management has not supplied an absolute MBO sales figure or a quarterly recovery schedule, so the claimed annual recovery remains a management expectation rather than a reported result.
The regional footprint offers another test of whether the channels can coexist. Management confirmed 71 stores in North and West India and 13 in South and East India. It said major expansion is occurring in North and West, where the network is more established, while differing regional sales trends are shaping the next stage of expansion.
Where will S D Retail expand its outlet network next?
S D Retail plans to focus more on East India after opening four stores there in H1 FY27, with management saying initial feedback on all four had been positive. Management described East as an open area for expansion, alongside North and West India, rather than a region where it is still only testing the format.
South India remains a test market because management said SSSG there was in single digits, against a blended chain average of 20%. As a result, management said expansion in the South will proceed slowly. This makes East the clearer near-term regional growth focus, while the South’s sales response remains an unresolved operating question.
The company is also seeking to improve store-level information flows. Its design team currently reviews weekly data and photographs on top and bottom sellers, while the SDBrain technology project is intended to provide that information in real time. A quicker response to product data could support the 84-store EBO base, although management did not give an implementation date for the system.
Conclusion
S D Retail’s channel mix is moving toward direct retail: EBOs contributed 35.8% of H1 FY27 revenue versus 25.36% previously, and the network rose to 84 stores from 64 a year earlier. Mature outlets generated Rs 21,266 per square foot annually versus Rs 14,559 at other stores, supporting management’s rationale for pursuing a larger own-store base despite the 10% H1 MBO decline.
The next measures to watch are progress toward management’s 50% EBO-revenue goal, whether MBO sales recover on an annualised basis, and performance in the four East India stores opened in H1 FY27. Management also plans slower South India expansion until its single-digit SSSG improves relative to the chain’s 20% blended average, while 70% of the planned price increase is incorporated in spring-summer 2027 products and the remaining 30% is planned for autumn-winter 2027.