










S D Retail EBITDA falls 5.5% as H1 revenue rises 16.6%
Key highlights
- S D Retail reported H1 FY 26–27 revenue of Rs 91.33 crore, up 16.6% from Rs 78.30 crore.
- S D Retail’s EBITDA fell 5.5% to Rs 2.06 crore as employee cost and other expenses increased by a combined Rs 7.74 crore.
- S D Retail’s PAT rose 153.8% to Rs 33 lakh as finance cost declined to Rs 69 lakh from Rs 1.90 crore.
- S D Retail generated Rs 9.46 crore of operating cash flow, compared with a Rs 70 lakh outflow a year earlier.
powered by IRIS
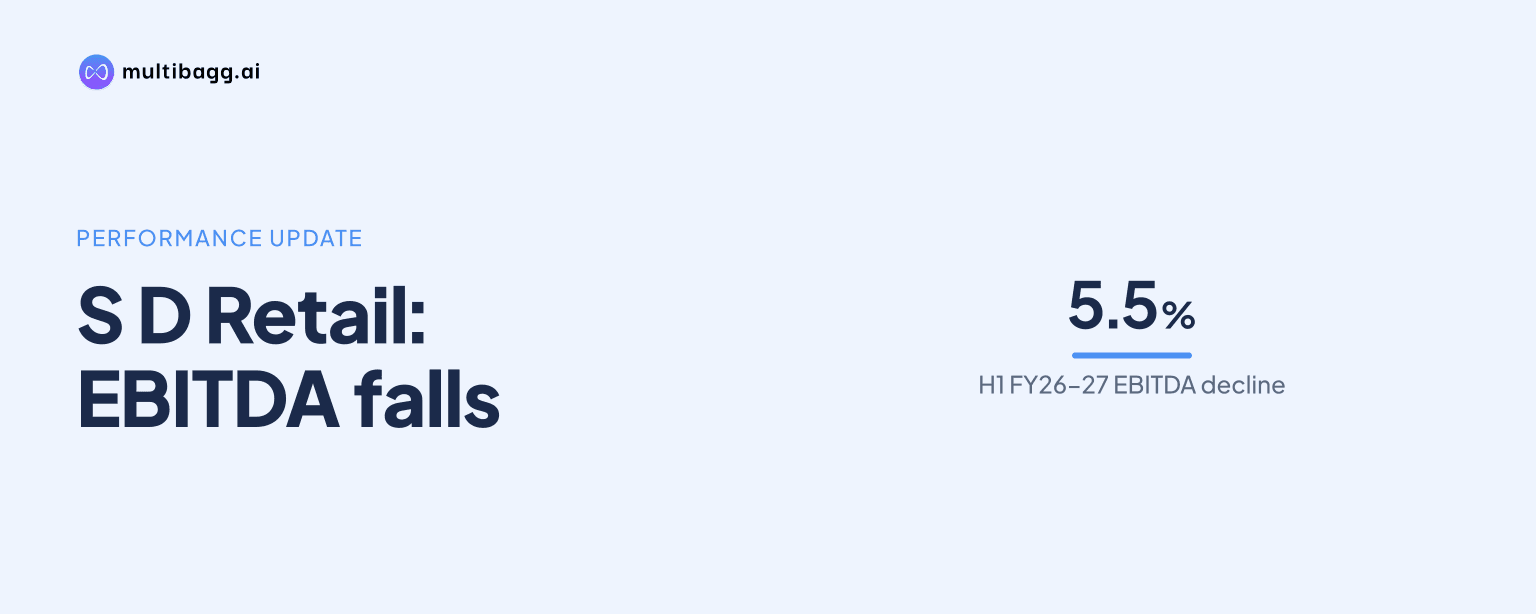
S D Retail Limited reported H1 FY 26–27 revenue of Rs 91.33 crore, up 16.6% year on year, but EBITDA fell 5.5% to Rs 2.06 crore as employee and other operating costs increased faster than gross profit. Lower finance cost helped profit after tax, or PAT, rise 153.8% to Rs 33 lakh.
Know S D Retail inside out
Results, valuation, peers and who's buying, in one view.
What were S D Retail’s H1 FY 26–27 financial results?
S D Retail grew revenue from operations by Rs 13.03 crore to Rs 91.33 crore in H1 FY 26–27 from Rs 78.30 crore in H1 FY 25–26. Gross profit increased by Rs 7.62 crore, or 17.5%, to Rs 51.10 crore from Rs 43.48 crore, while gross profit margin rose to 55.95% from 55.52%.
The higher gross profit did not translate into higher EBITDA. S D Retail reported EBITDA of Rs 2.06 crore, down from Rs 2.18 crore, and its EBITDA margin narrowed to 2.26% from 2.78%. PAT nevertheless rose to Rs 33 lakh from Rs 13 lakh, with PAT margin increasing to 0.36% from 0.17%.
Why did S D Retail’s EBITDA decline despite higher revenue?
S D Retail’s EBITDA declined because the Rs 7.74 crore combined increase in employee cost and other expenses was larger than the Rs 7.62 crore increase in gross profit. Employee cost rose to Rs 10.30 crore from Rs 8.61 crore, while other expenses increased to Rs 38.74 crore from Rs 32.69 crore in H1 FY 26–27.
Cost of material consumed rose to Rs 40.23 crore from Rs 34.82 crore, but gross margin still improved by 0.43 percentage points to 55.95%. The comparison indicates that the pressure on EBITDA arose after material costs, principally in employee and other operating expenses, rather than from a contraction in gross margin.
S D Retail said the Rs 2.06 crore EBITDA was before an exceptional expense of Rs 22 lakh for the write-off of capital expenditure associated with strategic store closures. Its profit-and-loss statement also records a Rs 22 lakh loss on discard of closed-store assets, while management said it opened 15 stores and closed six under-performing stores during H1 FY 26–27.
How did S D Retail’s PAT increase while EBITDA fell?
S D Retail’s PAT increased because finance cost fell by Rs 1.21 crore to Rs 69 lakh in H1 FY 26–27 from Rs 1.90 crore a year earlier. That reduction supported profit before tax of Rs 52 lakh, compared with Rs 37 lakh in H1 FY 25–26, despite the decline in EBITDA.
Depreciation fell to Rs 1.23 crore from Rs 1.61 crore, while other income declined to Rs 60 lakh from Rs 1.70 crore. As a result, earnings before interest and tax, or EBIT, declined to Rs 1.21 crore from Rs 2.27 crore, before the lower finance cost reduced the gap at the pre-tax level.
Tax expense decreased to Rs 19 lakh from Rs 24 lakh, leaving PAT of Rs 33 lakh against Rs 13 lakh. The reported 153.8% PAT growth reflects a Rs 20 lakh absolute increase from the relatively low prior-year profit base.
Got a follow-up? Ask IRIS
How is S D Retail changing its sales-channel mix?
S D Retail shifted more sales toward Exclusive Brand Outlets, or EBOs, which accounted for 36% of H1 FY 26–27 sales compared with 26% in H1 FY 25–26. Management said EBO revenue grew 65% year on year and separately described EBO contribution as 35.8% of total revenue, against 25.4% in FY 26.
Multi-Brand Outlets, or MBOs, represented 38% of H1 FY 26–27 sales, down from 50% a year earlier. Online sales increased to 17% from 16%, Large Format Stores, or LFS, rose to 7% from 6%, and other channels remained at 2%, making the EBO increase and MBO reduction the largest mix changes.
Management said it raised investment in marketing, customer acquisition, brand building and workforce capacity across sales, retail operations and support functions. The EBO network reached 84 stores after 15 openings and six closures, and management said it plans to accelerate additions to build visibility, improve gross margins and seek economies of scale.
What do S D Retail’s cash flow and balance-sheet figures show?
S D Retail generated net operating cash flow of Rs 9.46 crore in the half year ended September 30, 2026, compared with an outflow of Rs 70 lakh in the half year ended September 30, 2025. Cash generated from operations was Rs 11.53 crore versus Rs 2.09 crore, while income tax paid declined to Rs 2.07 crore from Rs 2.79 crore.
Cash and cash equivalents ended the half year at Rs 1.46 crore, compared with Rs 1.11 crore a year earlier and Rs 2.05 crore at the start of the half year. Net financing cash outflow was Rs 9.97 crore versus Rs 9.20 crore, while net investing cash flow was an outflow of Rs 8 lakh after an inflow of Rs 7.79 crore in the prior-year period.
Short-term borrowings fell to Rs 6.76 crore at September 30, 2026, from Rs 16.05 crore at March 31, 2026, while long-term borrowings decreased to Rs 12 lakh from Rs 21 lakh. Trade receivables declined to Rs 69.87 crore from Rs 81.53 crore, inventories rose to Rs 45.24 crore from Rs 44.06 crore, and cash and bank balances increased to Rs 18.15 crore from Rs 2.43 crore.
Conclusion
S D Retail’s H1 FY 26–27 results combined 16.6% revenue growth and a 0.43-percentage-point improvement in gross margin with a 5.5% EBITDA decline. Higher employee and other operating expenses absorbed the additional gross profit, while lower finance cost and tax expense enabled PAT to rise by Rs 20 lakh to Rs 33 lakh and operating cash flow to turn positive at Rs 9.46 crore.
The next operating measure to watch is management’s stated plan to accelerate EBO additions after reaching 84 outlets through 15 openings and six closures. Management says its EBO-led, asset-light model is intended to improve gross margins, inventory turns, cash flow and economies of scale, while the effect of marketing, customer-acquisition and workforce investment on EBITDA remains unresolved.