










Sweet Dreams EBO revenue rises 65% as mix reaches 35.8%
Key highlights
- Sweet Dreams’ EBO revenue grew 65% year on year in H1 FY 2026-27.
- Sweet Dreams’ EBO contribution reached 35.8% of sales, up from 25.4% in FY 2026.
- Sweet Dreams operated 84 EBOs at September 30, 2026, after opening 15 and closing six stores in H1.
- Sweet Dreams’ annual EBO sales per square foot rose 7.8% to Rs 17,647.
powered by IRIS
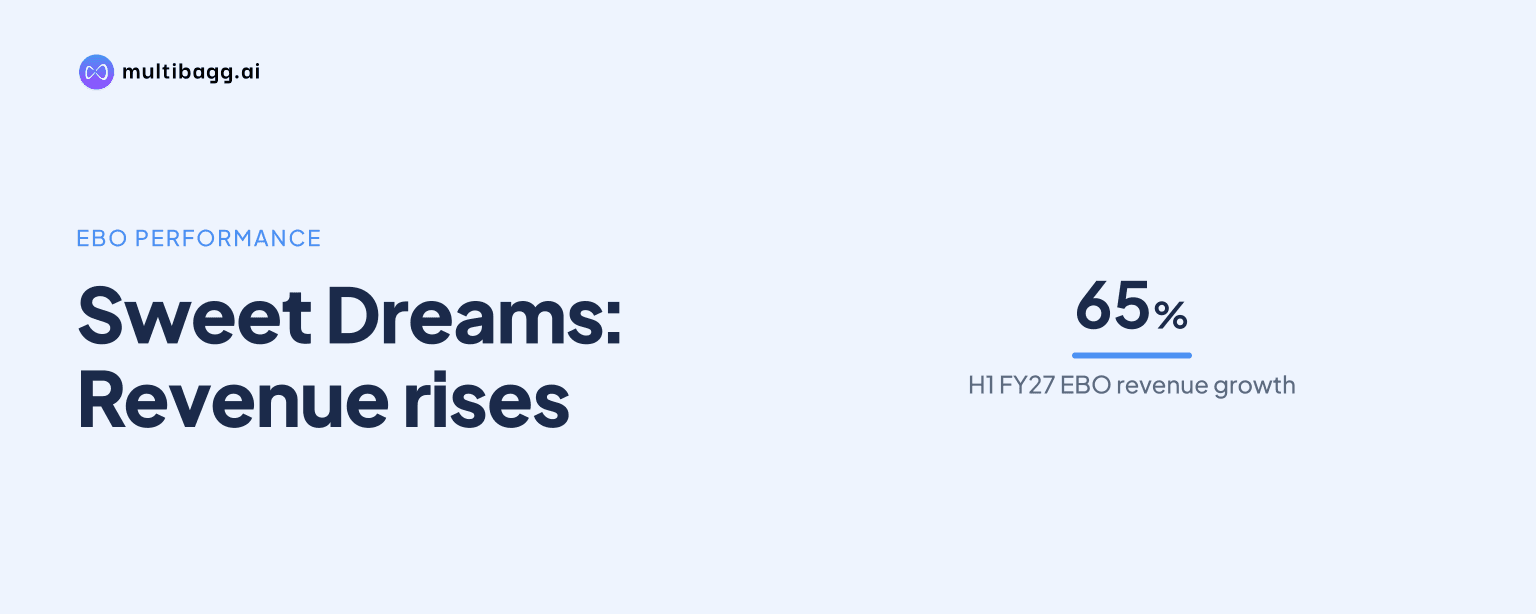
S D Retail Limited (Sweet Dreams) reported 65% year-on-year growth in Exclusive Brand Outlet revenue in H1 FY 2026-27, lifting EBOs to 35.8% of total revenue from 25.4% in FY 2026. The channel shift accompanied a 16.6% rise in revenue from operations to Rs 91.33 crore.
Know S D Retail inside out
Results, valuation, peers and who's buying, in one view.
How did Sweet Dreams’ sales mix change?
Sweet Dreams increased the sales contribution of EBOs to 35.8% in H1 FY 2026-27 from 25.4% in FY 2026, while Multi-Brand Outlet contribution declined to 38.4% from 50.2%. Management described the movement as a deliberate shift towards the higher-visibility, higher-margin EBO format. MBOs remained the largest reported channel by a narrow margin in H1 FY 2026-27.
The sales-mix slide, which compares the two half-year periods using rounded figures, shows the same direction. EBO share rose to 36% in H1 FY 2026-27 from 26% in H1 FY 2025-26, while MBO share fell to 38% from 50%. Online increased by 1 percentage point to 17%, Large Format Stores, or LFS, increased to 7% from 6%, and other channels remained at 2%.
Sweet Dreams’ revenue from operations grew to Rs 91.33 crore in H1 FY 2026-27 from Rs 78.30 crore a year earlier. EBO revenue growth of 65% was therefore faster than the company’s 16.6% revenue growth, consistent with EBOs taking a larger share of the sales mix. The presentation does not disclose absolute EBO revenue for either period.
What drove Sweet Dreams’ EBO revenue growth?
Sweet Dreams attributed its 65% EBO revenue growth in H1 FY 2026-27 to footprint expansion and healthy same-store sales growth, or SSSG. The presentation does not provide an SSSG percentage, but it reports that total EBO selling space rose 47.1% to 42,500 square feet from 28,900 square feet. The store network reached 84 EBOs at September 30, 2026.
During H1 FY 2026-27, Sweet Dreams opened 15 stores and closed six under-performing stores as part of portfolio optimisation. That equates to a net addition of nine stores during the half year. Separately, its EBO credentials comparison shows 84 stores in H1 FY 2026-27 against 64 in H1 FY 2025-26, an increase of 20 stores; the presentation does not reconcile these two comparison bases.
Store operating measures also increased. Average billing value rose 16.7% to Rs 4,429 from Rs 3,794, while average selling price, or ASP, rose 2.5% to Rs 1,755 from Rs 1,713. Annual sales per square foot increased 7.8% to Rs 17,647, and average store size rose 12% to 505 square feet.
How did the channel shift coincide with profitability?
Sweet Dreams reported gross profit of Rs 51.10 crore in H1 FY 2026-27, up 17.5% from Rs 43.48 crore in H1 FY 2025-26. Gross margin increased to 55.95% from 55.52%, a 0.43-percentage-point change, during the period when EBO sales grew faster than total revenue. Management has linked its EBO strategy to higher gross margins, but the presentation does not isolate the channel’s financial effect.
Earnings before interest, tax, depreciation and amortisation, or EBITDA, declined 5.5% to Rs 2.06 crore from Rs 2.18 crore. EBITDA margin fell to 2.26% from 2.78%. Employee cost increased to Rs 10.30 crore from Rs 8.61 crore, and other expenses rose to Rs 38.74 crore from Rs 32.69 crore as Sweet Dreams increased spending on marketing, customer acquisition, brand building, sales, retail operations and support functions.
Profit after tax rose to Rs 33 lakh from Rs 13 lakh, while finance cost fell to Rs 69 lakh from Rs 1.90 crore. The reported EBITDA of Rs 2.06 crore was before a Rs 22 lakh exceptional expense for writing off capital expenditure related to strategic store closures. Net cash flow from operating activities turned positive at Rs 9.46 crore, compared with an outflow of Rs 70 lakh in H1 FY 2025-26.
Got a follow-up? Ask IRIS
Where is Sweet Dreams expanding its EBO network?
Sweet Dreams operated 84 EBOs as of September 30, 2026, alongside more than 2,500 MBO placements, 65 LFS locations and nine marketplace platforms. Mall stores accounted for 58 EBOs, compared with 21 high-street stores and five airport stores. This distribution places 69% of the reported EBO network in malls.
Mumbai had the largest disclosed city network with 10 EBOs, followed by Pune with seven. Delhi and Ahmedabad had six each, while Gurugram had five. Noida, Lucknow and Amritsar each had three stores, and several cities including Chennai, Goa, Indore, Kochi, Nagpur, Patna, Surat and Vijayawada had one EBO each.
Sweet Dreams says its store strategy is to move sleepwear discovery from product placement in multi-brand stores to a branded retail experience. Its standalone EBOs offer assortment across men, women and kids, with hundreds of options, varied fabrics and inclusive size ranges. The company continues to sell through MBOs, LFS locations, its website and nine marketplace platforms.
What does Sweet Dreams plan to do next?
Sweet Dreams says it will continue accelerating store additions in coming periods after reaching 84 EBOs at September 30, 2026. Management says the planned expansion is intended to strengthen market share and brand visibility, improve gross margins and achieve economies of scale. The presentation does not provide a numerical EBO target or a timetable for future openings.
The operating requirements of the plan are visible in H1 FY 2026-27 figures: the company added 15 stores, closed six, increased total EBO area by 47.1%, and raised average billing value by 16.7%. Future reported results will show whether further additions sustain annual sales per square foot, which reached Rs 17,647 in the latest half-year comparison, while containing the employee and other expenses that increased in the period.
Conclusion
Sweet Dreams’ H1 FY 2026-27 results show a measurable migration towards owned retail. EBO revenue rose 65%, its revenue contribution reached 35.8%, and annual sales per square foot increased 7.8%, while MBO contribution declined to 38.4%. Company-wide revenue rose 16.6% and gross margin increased 0.43 percentage points, although EBITDA margin declined 0.52 percentage points.
The next disclosed issue to watch is the pace and economics of further EBO additions. Management plans to accelerate store openings from the 84-store base at September 30, 2026, but has not stated a store target or timetable. Store productivity, the level of closures, and the movement in operating costs will indicate how the expansion plan develops.