










Sai Silks Kalamandir Limited H1 FY27 profit falls 19.1%
Key highlights
- SSKL’s H1 FY 2026-27 revenue declined 1.73% to Rs 809.13 crore.
- SSKL’s H1 FY 2026-27 PAT declined 19.13% to Rs 56.73 crore.
- Inventory absorbed Rs 143.67 crore of cash in H1 FY 2026-27.
- SSKL used Rs 29.74 crore in operating activities, compared with a Rs 180.37 crore inflow a year earlier.
powered by IRIS
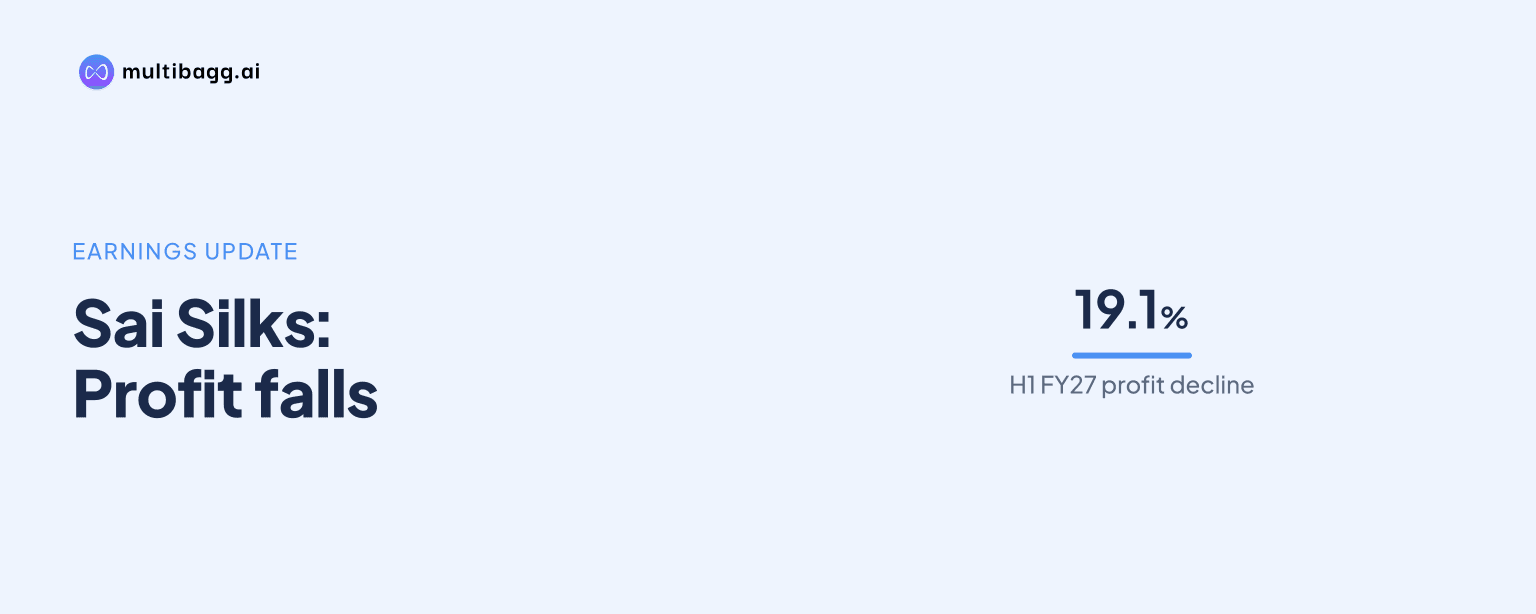
Sai Silks Kalamandir Limited reported profit after tax of Rs 56.73 crore in H1 FY 2026-27, down 19.13% year on year, as revenue from operations declined 1.73% to Rs 809.13 crore and operating activities used Rs 29.74 crore of cash. SSKL’s inventory-related working-capital outflow was Rs 143.67 crore.
Know Sai Silks (Kalamandir) inside out
Results, valuation, peers and who's buying, in one view.
Why did SSKL’s H1 FY27 profit fall faster than revenue?
SSKL’s profit fell faster than revenue because operating earnings and profit before tax declined by more than sales in H1 FY 2026-27. Revenue from operations decreased by Rs 14.22 crore to Rs 809.13 crore from Rs 823.35 crore in H1 FY 2025-26, while profit before tax fell by Rs 18.79 crore to Rs 75.86 crore from Rs 94.65 crore. Profit after tax, or PAT, decreased by Rs 13.41 crore to Rs 56.73 crore.
The income statement records higher employee, finance and other expenses despite lower revenue. Employee benefit expense increased to Rs 115.42 crore from Rs 106.81 crore, finance costs rose to Rs 17.18 crore from Rs 15.36 crore, and other expenses increased to Rs 111.14 crore from Rs 109.68 crore. Purchases of stock-in-trade declined to Rs 613.32 crore from Rs 616.78 crore.
The second quarter showed sequential improvement from the June 2026 quarter, while remaining below the prior-year quarter. Q2 FY 2026-27 revenue was Rs 434.05 crore, compared with Rs 375.08 crore in Q1 FY 2026-27 and Rs 444.33 crore in Q2 FY 2025-26. Q2 PAT was Rs 31.08 crore, above Rs 25.64 crore in Q1 but below Rs 40.08 crore a year earlier.
How did SSKL’s margins change in H1 FY27?
SSKL’s gross margin percentage was broadly unchanged, but its EBITDA and PAT margins declined in H1 FY 2026-27. Gross margin was 42.02%, compared with 41.98% in H1 FY 2025-26, while EBITDA margin fell to 14.02% from 15.68%. PAT margin decreased to 7.01% from 8.52%, a decline of 1.51 percentage points.
The gross-margin amount fell by Rs 5.63 crore to Rs 340.00 crore, less than the Rs 15.70 crore fall in EBITDA to Rs 113.44 crore. Below the gross-margin line, SSKL recorded employee benefit expense of Rs 115.42 crore, finance costs of Rs 17.18 crore and depreciation and amortisation expense of Rs 30.91 crore for the half year ended September 30, 2026.
Q2 margins followed the same pattern as the half-year result. Q2 FY 2026-27 gross margin was 42.10%, compared with 41.90% in Q2 FY 2025-26, while EBITDA margin declined to 14.19% from 16.21%. Q2 PAT margin fell to 7.16% from 9.02%, alongside a Rs 10.43 crore decline in EBITDA to Rs 61.58 crore.
Got a follow-up? Ask IRIS
Why did SSKL’s operating cash flow turn negative?
SSKL’s operating cash flow turned negative as inventory absorbed Rs 143.67 crore and the cash contribution from trade payables was lower than in the prior-year half. Net cash used in operating activities was Rs 29.74 crore in H1 FY 2026-27, compared with net cash generated of Rs 180.37 crore in H1 FY 2025-26. Cash generated from operations before tax was a Rs 9.42 crore outflow, versus a Rs 218.13 crore inflow a year earlier.
Operating profit before working-capital changes remained positive at Rs 111.43 crore, but was below Rs 141.70 crore in H1 FY 2025-26. Inventory was the largest working-capital outflow at Rs 143.67 crore, compared with Rs 141.98 crore a year earlier. Trade payables contributed Rs 35.47 crore of cash, compared with Rs 210.69 crore in the prior-year half, and income tax paid was Rs 20.33 crore.
Inventories stood at Rs 959.59 crore on September 30, 2026, compared with Rs 815.93 crore on March 31, 2026. SSKL says it plans inventory in advance using sales forecasts, seasonal demand and design trends. Its supply-chain infrastructure includes an 80-member procurement team, more than 4,000 master weavers, weavers and vendors, and 2,20,360 square feet of warehousing capacity.
What changed in SSKL’s balance sheet and liquidity?
SSKL’s total assets increased to Rs 1,956.33 crore on September 30, 2026 from Rs 1,848.91 crore on March 31, 2026, with inventories and right-of-use assets among the larger movements. Right-of-use assets rose to Rs 346.33 crore from Rs 309.87 crore, while property, plant and equipment increased to Rs 283.22 crore from Rs 273.12 crore. Total equity increased to Rs 1,293.60 crore from Rs 1,260.47 crore.
Cash and cash equivalents declined to Rs 12.26 crore at September 30, 2026 from Rs 19.38 crore at the March year-end. Bank balances other than cash and cash equivalents fell to Rs 236.32 crore from Rs 329.04 crore, while the cash-flow statement recorded a Rs 92.72 crore decrease in deposits under investing activities. Net cash generated from investing activities was Rs 75.11 crore, compared with a Rs 34.98 crore outflow in the prior-year half.
Lease liabilities increased with right-of-use assets. Non-current lease liabilities were Rs 360.48 crore on September 30, 2026, up from Rs 323.60 crore on March 31, while current lease liabilities were Rs 17.77 crore against Rs 17.40 crore. Current borrowings declined to Rs 3.57 crore from Rs 7.26 crore, and non-current borrowings declined to Rs 12.16 crore from Rs 12.96 crore.
Conclusion
SSKL’s H1 FY 2026-27 figures show that a Rs 14.22 crore reduction in revenue was accompanied by a Rs 15.70 crore fall in EBITDA and a Rs 13.41 crore decline in PAT. Gross margin percentage was stable at 42.02%, but EBITDA and PAT margins declined, while operating cash flow moved from a Rs 180.37 crore inflow to a Rs 29.74 crore outflow.
The unresolved items to watch are the Rs 959.59 crore inventory balance, the Rs 143.67 crore inventory-related cash outflow and cash and cash equivalents of Rs 12.26 crore at September 30, 2026. SSKL’s disclosed inventory process includes forecasting, barcoding, an in-house enterprise resource planning system and artificial intelligence and machine-learning store-level insights, which are the mechanisms it identifies for tracking inventory movement and demand.