










Sanghvi Movers Limited H1 cash flow trails investment outflows
Key highlights
- SML generated Rs 231 crore of net operating cash flow in H1 FY27, compared with Rs 118 crore a year earlier.
- SML used Rs 258 crore in net investing activities during H1 FY27, exceeding operating cash flow by Rs 27 crore.
- SML's total assets reached Rs 2,532 crore at 30 September 2026, up Rs 189 crore from 31 March 2026.
- SML's long-term borrowings rose to Rs 607 crore at 30 September 2026 from Rs 495 crore at 31 March 2026.
powered by IRIS
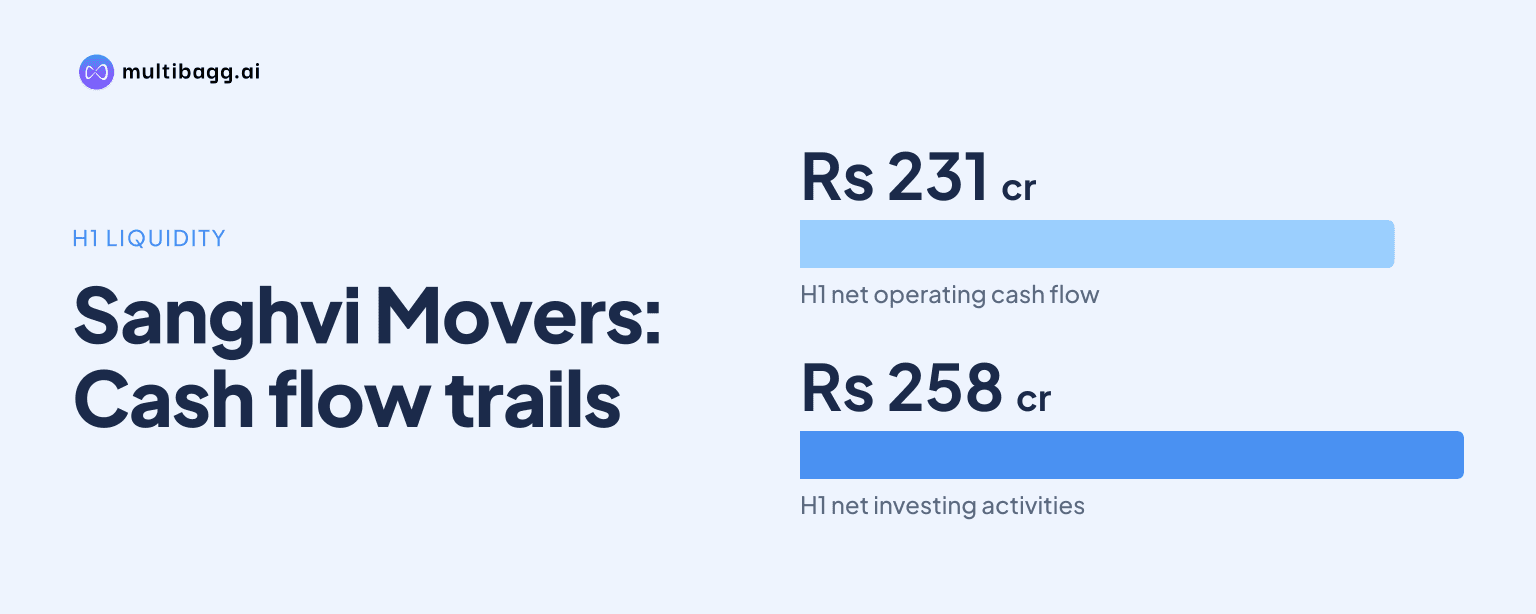
Sanghvi Movers Limited generated Rs 231 crore of net operating cash flow in H1 FY27, up from Rs 118 crore a year earlier, but its Rs 258 crore investing outflow exceeded that inflow. Total assets reached Rs 2,532 crore on 30 September 2026, compared with Rs 2,343 crore at 31 March 2026.
Know Sanghvi Movers inside out
Results, valuation, peers and who's buying, in one view.
How did SML's operating cash flow change in H1 FY27?
SML's net cash flow from operating activities rose by Rs 113 crore to Rs 231 crore for the six months ended 30 September 2026, from Rs 118 crore in the six months ended 30 September 2025. Cash generated from operations increased to Rs 270 crore from Rs 147 crore, while income tax paid rose to Rs 39 crore from Rs 29 crore.
Operating profit before working-capital changes was Rs 240 crore in H1 FY27, compared with Rs 185 crore a year earlier, and profit before tax increased to Rs 142 crore from Rs 118 crore. The difference between operating profit before working-capital changes and cash generated from operations was Rs 30 crore in H1 FY27, against a negative Rs 38 crore difference in H1 FY26.
SML reported cash profit of Rs 181 crore in H1 FY27, compared with Rs 149 crore in H1 FY26, while consolidated profit after tax increased to Rs 106 crore from Rs 87 crore. Depreciation and amortisation expense rose to Rs 76 crore from Rs 63 crore, providing context for the gap between reported profit after tax and cash profit.
Why did SML's investing outflow exceed operating cash flow?
SML used Rs 258 crore in net investing activities in H1 FY27, which was Rs 27 crore more than its Rs 231 crore operating cash inflow and Rs 126 crore more than the Rs 132 crore outflow reported in H1 FY26. The cash-flow statement provides only the net investing amount, so it does not identify each use of the Rs 258 crore.
The presentation separately records total capital expenditure of Rs 182 crore in H1 FY27, compared with Rs 474 crore in FY26 and Rs 235 crore in FY25. Because net investing cash flow was Rs 258 crore, the disclosed figures do not establish that all investing outflow was capital expenditure.
Gross block rose to Rs 3,391 crore in H1 FY27 from Rs 3,217 crore in FY26, while utilisation was 78%, compared with 79% in FY26. Yield increased to 2.15% from 2.12%, and management's annexure describes India utilisation as remaining within a 73% to 84% range over FY22 through H1 FY27.
Got a follow-up? Ask IRIS
How did SML's assets change by September 2026?
SML's total assets increased by Rs 189 crore to Rs 2,532 crore at 30 September 2026 from Rs 2,343 crore at 31 March 2026, and were Rs 590 crore above the Rs 1,942 crore recorded at 30 September 2025. Non-current assets increased by Rs 205 crore from the March 2026 date, while current assets decreased by Rs 16 crore.
Property, plant and equipment stood at Rs 1,481 crore at 30 September 2026, up from Rs 1,421 crore at 31 March 2026 and Rs 1,180 crore a year earlier. Capital work-in-progress increased to Rs 58 crore from Rs 9 crore at March 2026, while other non-current assets rose to Rs 93 crore from Rs 20 crore.
Trade receivables decreased to Rs 213 crore at 30 September 2026 from Rs 271 crore at 31 March 2026, and unbilled receivables fell to Rs 126 crore from Rs 154 crore. Other current assets nevertheless increased to Rs 382 crore from Rs 283 crore, although total current assets declined to Rs 826 crore from Rs 842 crore because cash and cash equivalents including bank balance fell to Rs 99 crore from Rs 129 crore.
How was SML's balance-sheet expansion financed?
SML reported Rs 50 crore of net financing cash inflow in H1 FY27, compared with Rs 23 crore in H1 FY26. Combined with Rs 231 crore from operations and Rs 258 crore used in investing, this produced a Rs 22 crore increase in cash and cash equivalents in the cash-flow statement, from Rs 46 crore at the beginning of the period to Rs 68 crore at its end.
Long-term borrowings increased to Rs 607 crore at 30 September 2026 from Rs 495 crore at 31 March 2026 and Rs 267 crore a year earlier. Short-term borrowings were Rs 198 crore, compared with Rs 179 crore at March 2026 and Rs 226 crore at September 2025, meaning the year-on-year increase in borrowings was concentrated in the long-term category.
Total equity rose by Rs 88 crore from March 2026 to Rs 1,398 crore at 30 September 2026. SML reported gross debt to equity of 0.58 in H1 FY27, up from 0.51 in FY26 and 0.38 in FY25, while return on capital employed was 16%, unchanged from FY26.
The balance sheet and cash-flow statement report different cash labels at 30 September 2026. The balance sheet shows Rs 99 crore of cash and cash equivalents including bank balance, whereas the cash-flow statement shows Rs 68 crore of cash and cash equivalents at period-end; the supplied presentation does not reconcile the Rs 31 crore difference.
Conclusion
SML's H1 FY27 statements show that a Rs 113 crore year-on-year increase in operating cash flow to Rs 231 crore occurred alongside Rs 258 crore of investing outflow. The balance-sheet expansion to Rs 2,532 crore was led by a Rs 205 crore increase in non-current assets, while long-term borrowings rose by Rs 112 crore from the March 2026 position.
The next disclosures under SML's Elevate 2030 plan can show whether fleet expansion continues to translate into utilisation and yield. Management reported H1 FY27 gross block of Rs 3,391 crore, capital expenditure of Rs 182 crore, utilisation of 78% and yield of 2.15%, after describing growth capital expenditure as having reaccelerated in FY26.