










Satin Creditcare H1 profit reaches Rs 292 crore as slippages fall
Key highlights
- Satin Creditcare reported record H1 FY27 standalone PAT of Rs 292 crore, compared with Rs 302 crore for all of FY26.
- H1 FY27 slippages fell 68% year on year to Rs 103 crore from Rs 317 crore.
- Standalone GNPA improved to 1.9% from 3.5% a year earlier, while provision coverage reached 133%.
- Consolidated AUM reached Rs 16,589 crore, up 31% year on year.
powered by IRIS
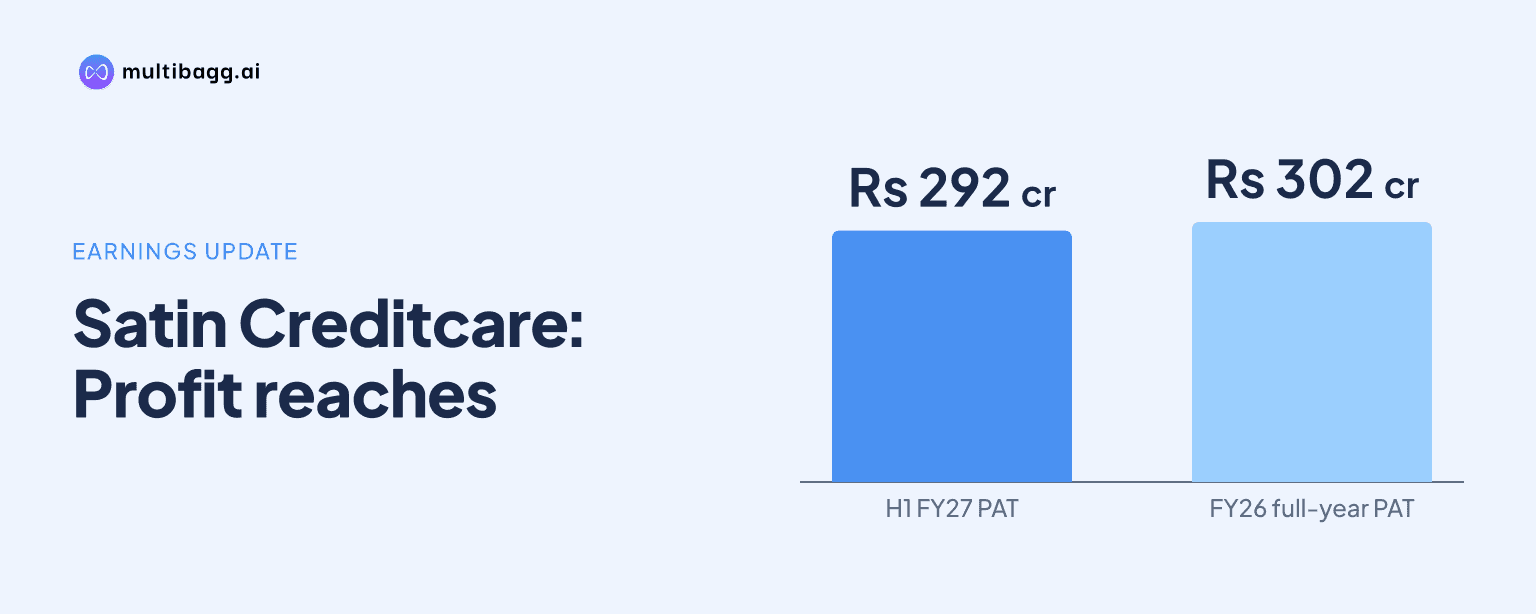
Satin Creditcare Network Limited reported record H1 FY27 standalone profit after tax of Rs 292 crore, as slippages fell 68% year on year to Rs 103 crore from Rs 317 crore. Satin Creditcare’s result nearly matched its Rs 302 crore standalone profit for all FY26, while management continued building provisions through a management overlay.
Know Satin Creditcare Network inside out
Results, valuation, peers and who's buying, in one view.
How did Satin Creditcare’s H1 FY27 profit compare with last year?
Satin Creditcare’s consolidated profit after tax (PAT) rose to Rs 299 crore in H1 FY27 from Rs 98 crore in H1 FY26, while standalone PAT reached a record Rs 292 crore. The standalone result was Rs 10 crore below the Rs 302 crore profit reported for the whole of FY26, and management said this was the company’s 21st consecutive profitable quarter.
The second quarter contributed Rs 172 crore of standalone PAT, up 231% year on year. Consolidated Q2 PAT was Rs 176 crore, also up 231% year on year and 43% sequentially, while consolidated pre-provision operating profit (PPOP) increased 53% to Rs 324 crore in Q2 and 43% to Rs 590 crore in H1.
Satin Creditcare also reported lower operating costs relative to income in Q2 FY27. Its operating-expense ratio declined to 6.6% from 7.2% a year earlier, while the cost-to-income ratio improved to 41.6% from 49.8%; standalone return on assets (ROA) was 4.3% and return on equity (ROE) was 17.8% for H1.
Why did Satin Creditcare’s asset quality improve in H1 FY27?
Satin Creditcare said the main asset-quality change was the 68% year-on-year reduction in H1 slippages to Rs 103 crore from Rs 317 crore. Reported standalone credit cost was 2.77% for H1 FY27 and 2% excluding the management overlay, both below management’s FY27 guidance range of 3% to 3.5%.
Standalone gross non-performing assets (GNPA) declined to 1.9% at the end of Q2 FY27 from 2.2% in June and 3.5% a year earlier. Gross NPAs stood at Rs 197 crore, portfolio at risk for one day or more was 2.9%, and ex-pocket collection efficiency was 99.8%.
Satin Creditcare increased coverage even as slippages declined. On-book provisions were Rs 263 crore against gross NPAs of Rs 197 crore and a Rs 152 crore requirement under the cited norms; the overall provision coverage ratio increased to 133% from 115% in June.
Coverage also rose across delinquency buckets, with Stage 3 coverage reaching 91% from 85% in June and Phase 2 coverage increasing to 62% from 21%. Satin Creditcare recovered Rs 16 crore against write-offs in H1 FY27, while Q2 reported credit cost declined to 2.47% from 4.83% a year earlier.
How much profit buffer did Satin Creditcare build in Q2 FY27?
Satin Creditcare increased its management overlay to Rs 50 crore in Q2 FY27 from Rs 36 crore, adding Rs 14 crore during the quarter. Management said standalone Q2 credit cost would have been 0.99% excluding the overlay, compared with the reported 2.47%.
Management said the overlay lowered reported standalone Q2 ROA to 4.9% from an adjusted 6% and reported ROE to 20.6% from an adjusted 25%. On a consolidated basis, management calculated Q2 adjusted ROA of 5.5% and ROE of 27.7%, compared with reported ROA of 4.5% and ROE of 22.8%.
Management described the decision as absorbing more than 100 basis points of ROA into the balance sheet during lower credit stress. It said Satin Creditcare would continue to disclose reported and adjusted returns each quarter while building a buffer in benign credit conditions.
Satin Creditcare also adopted Grameen Score for microfinance customer evaluation alongside PIN-code risk scoring and early-warning indicators. The sourcing-to-disbursement ratio was 34%, cashless collections reached 25% of total collections through customer adoption, and disbursements remained 100% cashless.
Got a follow-up? Ask IRIS
Is Satin Creditcare expanding while limiting concentration risks?
Satin Creditcare’s consolidated assets under management (AUM) reached Rs 16,589 crore, up 31% year on year, while standalone AUM was Rs 13,608 crore, up 23%. Consolidated Q2 disbursements rose 41% year on year to Rs 3,697 crore, taking H1 disbursements to Rs 7,192 crore, up 48%.
Management said Karnataka and Maharashtra each represented 1% of the on-book portfolio and that Satin Creditcare had not seen repayment stress in either state despite drought concerns. In Assam, 42,394 borrowers received a moratorium after flooding in four districts, and nearly 90% resumed repayments during the moratorium period itself.
Management said no part of the Rs 50 crore overlay was needed for the Assam flood event and that it would pass the entire natural-catastrophe insurance payout to affected customers. The company added 1.9 lakh clients in Q2 and 4.2 lakh in H1, serving 34.1 lakh clients through 2,075 branches as of September 30.
Non-microfinance lending accounted for 20% of consolidated AUM, up from 15% a year earlier. Satin Creditcare reiterated its 2030 target of Rs 32,000 crore in consolidated AUM, with 30% from non-microfinance businesses, and management said the company had achieved 50% of the total AUM target.
Which businesses are driving Satin Creditcare’s diversification?
Satin Finserv’s AUM rose 184% year on year and 29% sequentially to Rs 1,761 crore, while its GNPA improved to 3.07% from 3.49% in June. The unit made H1 disbursements of Rs 967 crore and had 140 branches across 116 states after adding 19 branches during Q2, according to management.
Satin Housing Finance reported AUM of Rs 1,219 crore, up 19% year on year, with capital adequacy of 57.67% and gearing of 1.70 times. Management said Satin Creditcare had slowed housing originations for two quarters while rebuilding the sourcing and underwriting process, and increased its housing field team to 512 from 370.
At the group level, capital adequacy increased to 27.89% from 26.74% in June and 26.5% a year earlier. Net worth rose to Rs 3,437 crore from Rs 3,243 crore in June, while leverage declined to 2.9 times from 3.2 times; liquidity stood at Rs 2,235 crore on September 30.
Conclusion
Satin Creditcare’s H1 FY27 result combined record standalone PAT of Rs 292 crore with a Rs 214 crore year-on-year reduction in slippages, lower credit costs and higher provision coverage. The improvement was not solely a result of lending growth, as management continued to add to its Rs 50 crore overlay rather than release provisions into reported profit.
The next measure is whether H2 disbursements bring full-year consolidated AUM growth into management’s 20% to 25% guidance range. Consolidated AUM growth was 9% in the first half, and management said a seasonally stronger second half and its current pipeline should support the range while standalone credit cost remains within the guided 3% to 3.5%.