










SBI Gross NPA Ratio Reaches 1.39% as SMA Balance Rises
Key highlights
- SBI's gross NPA ratio declined to 1.39% in Sep 26 from 1.73% in Sep 25.
- SBI's gross NPA balance fell Rs 1,743 crore quarter on quarter to Rs 72,529 crore in Sep 26.
- SBI's SMA1 and SMA2 balance increased to Rs 4,801 crore in Sep 26 from Rs 4,174 crore in Jun 26.
- SBI's H1FY27 slippages were Rs 12,273 crore, compared with Rs 12,699 crore in H1FY26.
powered by IRIS
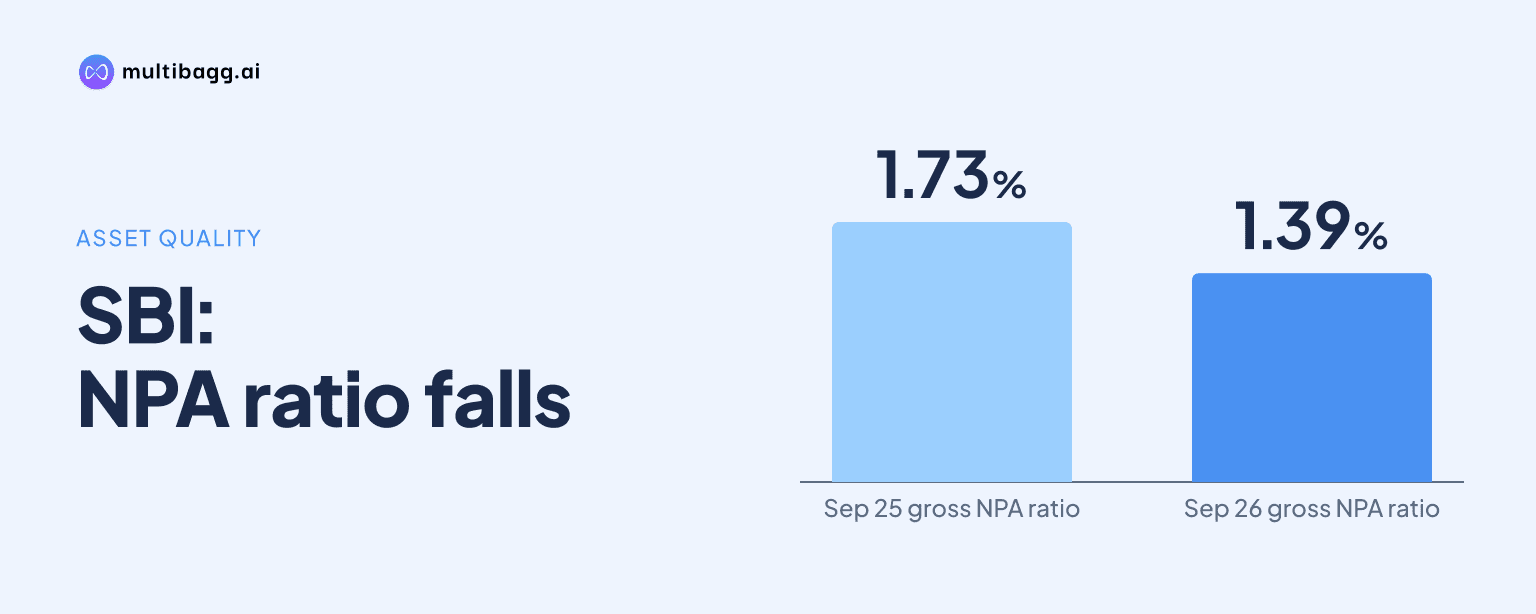
SBI reported a 1.39% gross non-performing asset (NPA) ratio in Sep 26, down from 1.73% in Sep 25, while its SMA1 and SMA2 balance for accounts with exposure above Rs 5 crore rose Rs 627 crore quarter on quarter to Rs 4,801 crore. The data show lower reported NPAs alongside a higher separately reported early-stress balance.
Know State Bank of India inside out
Results, valuation, peers and who's buying, in one view.
How much did SBI's NPA ratios improve in Sep 26?
SBI's reported NPA ratios improved in Sep 26, with gross NPAs at 1.39% and net NPAs at 0.36%, compared with 1.47% and 0.38%, respectively, in Jun 26. Gross NPAs declined Rs 1,743 crore quarter on quarter to Rs 72,529 crore, while net NPAs fell Rs 612 crore to Rs 18,546 crore. Against Sep 25, the gross NPA ratio declined 34 basis points from 1.73%, and the net NPA ratio fell six basis points from 0.42%.
Other reported asset-quality measures also moved lower in Sep 26. Credit cost was 0.25%, compared with 0.27% in Jun 26 and 0.43% in Sep 25, while the cumulative slippage ratio was 0.50%, versus 0.57% and 0.60%, respectively. The provision coverage ratio was 74.43%, marginally above 74.20% in Jun 26 but below 75.79% a year earlier.
What reduced SBI's gross NPA balance in Q2FY27?
SBI's gross NPA balance declined in Q2FY27 because total reductions of Rs 7,120 crore exceeded gross additions of Rs 5,377 crore, resulting in a net decrease of Rs 1,743 crore. Recovery and upgradation accounted for Rs 3,235 crore of the reductions. Fresh slippages were Rs 5,227 crore, while the increase in outstanding balances was Rs 150 crore, and closing gross NPAs were Rs 72,529 crore.
The Q2FY27 movement reversed the increase recorded in Q1FY27, when gross NPAs rose Rs 820 crore. In Q1FY27, gross additions were Rs 7,359 crore, including Rs 7,046 crore of fresh slippages, against total reductions of Rs 6,539 crore. For H1FY27, slippages were Rs 12,273 crore, lower than Rs 12,699 crore in H1FY26; the Sep 26 quarterly slippage of Rs 5,227 crore was also lower than Rs 7,046 crore in Jun 26.
Which SBI segments had the highest NPA ratios in Sep 26?
SBI's agriculture portfolio had the highest listed segmental NPA ratio at 6.56% in Sep 26, followed by small and medium enterprises (SME) at 2.87% and retail at 2.06%. Agriculture NPAs were Rs 29,608 crore, down from Rs 30,729 crore in Jun 26, and the agriculture ratio fell from 7.03%. Retail NPAs declined to Rs 60,413 crore from Rs 61,560 crore, while its ratio declined from 2.16%.
Personal loans had an NPA ratio of 0.65% and an NPA balance of Rs 11,828 crore in Sep 26, compared with 0.67% and Rs 11,910 crore in Jun 26. Corporate NPAs fell to Rs 11,185 crore, with a 0.78% ratio, from Rs 11,784 crore and 0.83% in Jun 26. International NPAs were Rs 931 crore at a 0.11% ratio, versus Rs 928 crore and 0.12% three months earlier.
Got a follow-up? Ask IRIS
Why did SBI's SMA balance rise as NPAs declined?
SBI's combined SMA1 and SMA2 balance increased because SMA1 rose Rs 778 crore during Q2FY27, more than offsetting a Rs 151 crore reduction in SMA2. The total was Rs 4,801 crore in Sep 26, compared with Rs 4,174 crore in Jun 26 and Rs 3,762 crore in Sep 25. The presentation specifies that these data cover accounts with exposure above Rs 5 crore.
The increase was concentrated in SMA1, which reached Rs 3,265 crore in Sep 26 from Rs 2,487 crore in Jun 26 and Rs 1,769 crore in Sep 25. SMA2 declined to Rs 1,536 crore from Rs 1,687 crore in Jun 26, and was also below Rs 1,992 crore in Sep 25. SBI reports SMA1 and SMA2 separately from gross and net NPAs, making them distinct disclosed measures of credit stress.
What capital position accompanied SBI's asset-quality results?
SBI reported a capital to risk-weighted assets ratio (CRAR) of 16.09% in Sep 26, against a stated minimum regulatory total-capital requirement of 12.30%. Its common equity tier 1 (CET-1) ratio was 13.34%, compared with the stated minimum of 8.80%. CRAR rose from 15.67% in Jun 26, while CET-1 increased from 12.89%; SBI noted that profit plough-back was effected in the Jun 26 and Sep 26 quarters under the revised Reserve Bank of India framework.
Risk-weighted assets (RWAs) were 52.09% of total assets in Sep 26, down from 52.56% in Jun 26 and 52.81% in Sep 25. Credit risk-weighted assets on advances as a share of gross advances declined to 52.11% from 53.33% in Jun 26 and 55.99% in Sep 25. The additional tier 1 ratio was 1.00% and the tier 2 ratio was 1.75% in Sep 26.
Conclusion
SBI's Sep 26 presentation records lower gross and net NPA ratios, lower credit cost and lower H1FY27 slippages than in H1FY26. The Rs 1,743 crore quarterly reduction in gross NPAs resulted from Rs 7,120 crore of reductions exceeding Rs 5,377 crore of gross additions, taking the gross NPA ratio to 1.39%.
The key disclosed matter to watch in subsequent results is the SMA1 and SMA2 balance, which rose to Rs 4,801 crore in Sep 26 as SMA1 reached Rs 3,265 crore. Fresh slippages, recoveries and upgrades, as well as the agriculture NPA ratio of 6.56% and SME ratio of 2.87%, will indicate how that separately reported stress balance develops.