










SBI Q2 profit rises 14.28% as fund-sale gain lifts income
Key highlights
- SBI’s Q2FY27 net profit rose 14.28% year on year to ₹23,038 crore.
- SBI recorded a ₹7,288 crore one-time profit from selling a stake in SBI Funds Management in Q2FY27.
- SBI’s Q2FY27 net interest income increased 14.69% year on year to ₹49,143 crore.
- SBI’s Q2FY27 total provisions fell 4.74% year on year to ₹11,188 crore.
powered by IRIS
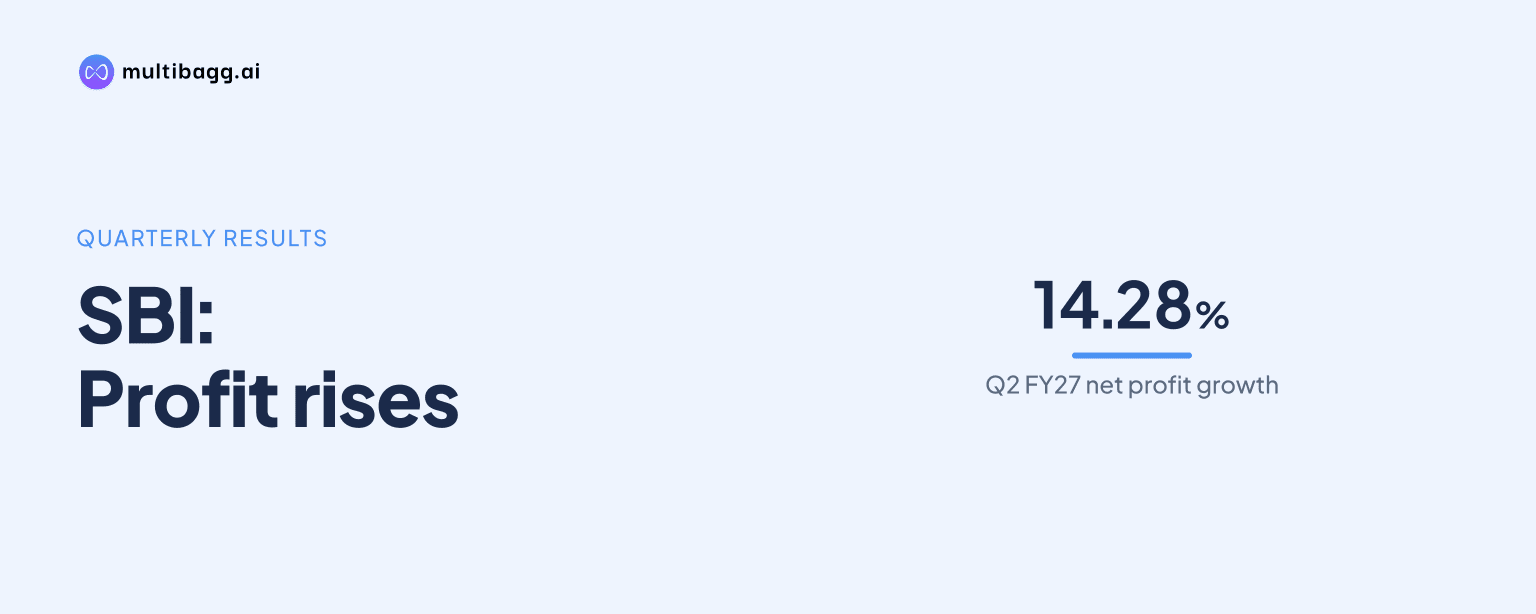
State Bank of India reported Q2FY27 net profit of ₹23,038 crore, up 14.28% year on year, supported by a ₹7,288 crore one-time gain on selling a stake in SBI Funds Management. SBI’s net interest income rose 14.69% to ₹49,143 crore, while operating profit increased 7.28% to ₹34,226 crore.
Know State Bank of India inside out
Results, valuation, peers and who's buying, in one view.
How much did SBI earn in Q2FY27?
SBI earned net profit of ₹23,038 crore in Q2FY27, compared with ₹20,160 crore in Q2FY26 and ₹21,121 crore in Q1FY27. The result represented 14.28% year-on-year growth and 9.07% sequential growth. Non-interest income included the ₹7,288 crore one-time profit from the SBI Funds Management stake sale.
The year-on-year comparison also contains a one-time gain in the earlier period. SBI recorded ₹4,593 crore of profit from selling a stake in Yes Bank in Q2FY26. Total non-interest income nonetheless fell 4.94% year on year to ₹19,066 crore in Q2FY27 from ₹20,056 crore, meaning the comparison reflects different non-recurring gains in both quarters.
SBI’s H1FY27 net profit was ₹44,159 crore, up 12.31% from ₹39,320 crore in H1FY26. Operating profit for the half year increased 8.50% to ₹67,755 crore. Quarterly net-profit growth was faster than operating-profit growth, alongside the stake-sale gain and a 4.74% year-on-year reduction in Q2FY27 total provisions.
What did SBI’s interest income show in Q2FY27?
SBI’s net interest income, or NII, rose 14.69% year on year to ₹49,143 crore in Q2FY27 and increased 4.58% from ₹46,992 crore in Q1FY27. Interest income increased 10.46% to ₹1,32,019 crore, exceeding the 8.09% rise in interest expenses to ₹82,876 crore. The difference produced a ₹6,296 crore year-on-year increase in quarterly NII.
Interest on loans was ₹97,464 crore, up 13.09% from ₹86,183 crore in Q2FY26 and 3.67% above Q1FY27. Interest on resources increased 6.15% year on year to ₹31,813 crore, while other interest income declined 18.50% to ₹2,741 crore. Loan interest accounted for the largest stated component of total interest income.
Whole-bank net interest margin, or NIM, was 2.94% in Q2FY27, 8 basis points above Q1FY27’s 2.86% but 2 basis points below Q2FY26’s 2.96%. Domestic NIM was 3.11%, compared with 3.00% in Q1FY27 and 3.08% a year earlier. For H1FY27, whole-bank NIM was 2.90%, 2 basis points below H1FY26, while domestic NIM rose 2 basis points to 3.06%.
Got a follow-up? Ask IRIS
How did SBI’s fee and non-interest income change?
SBI’s fee income increased 9.63% year on year to ₹9,549 crore in Q2FY27 and was 0.77% above ₹9,476 crore in Q1FY27. Loan processing charges rose 36.92% from a year earlier to ₹2,343 crore, while commission on government business increased 18.19% to ₹1,339 crore. H1FY27 fee income reached ₹19,025 crore, up 14.93%.
Some fee categories declined despite the overall increase. Remittance and collection income fell 21.56% year on year to ₹1,616 crore and was 8.61% below Q1FY27. Commission on letters of credit and bank guarantees rose 6.42% to ₹909 crore, while CVE income increased 10.58% year on year to ₹1,389 crore.
Profit or loss on sale or revaluation of investments was ₹6,011 crore in Q2FY27, up 39.16% sequentially but down 19.53% from Q2FY26. Foreign exchange and derivatives income declined 45.99% year on year to ₹529 crore. Miscellaneous income was ₹2,977 crore, up 2.79% from Q2FY26; the presentation identifies the ₹7,288 crore SBI Funds Management stake-sale profit within total non-interest income, without specifying a line-item classification.
What happened to SBI’s costs, provisions and returns?
SBI’s operating expenses rose 9.63% year on year to ₹33,983 crore in Q2FY27, compared with an 8.44% increase in operating income to ₹68,209 crore. Expenses were also 15.64% above Q1FY27’s ₹29,386 crore. Operating profit therefore increased 7.28% year on year to ₹34,226 crore, slower than NII growth.
Staff expenses were ₹17,452 crore, up 5.09% year on year, comprising salary costs of ₹12,860 crore and employee provisions of ₹4,592 crore. Overheads increased 14.86% to ₹16,531 crore. Business acquisition and development expenses rose 61.07% to ₹2,004 crore, while automated teller machine, cash deposit machine, debit-card and other expenses increased 10.23% to ₹3,226 crore.
Total provisions declined 4.74% year on year to ₹11,188 crore and fell 9.83% from Q1FY27. Loan-loss provisions were ₹2,759 crore, down 33.23% from Q2FY26, while standard-asset provisions declined 68.57% to ₹377 crore. Annualised return on assets was 1.19% in Q2FY27, compared with 1.17% in Q2FY26, while earnings per share rose to ₹99.02 from ₹87.28.
Conclusion
SBI’s Q2FY27 outcome combined higher core interest income with a material one-time stake-sale gain. NII rose 14.69%, operating profit increased 7.28% and total provisions fell 4.74%, while the ₹7,288 crore SBI Funds Management gain helped lift reported net profit by 14.28% to ₹23,038 crore. The Q2FY26 comparison also included a ₹4,593 crore Yes Bank stake-sale profit.
The next result will show whether SBI can sustain NII growth while managing the expense trend, after operating expenses rose 15.64% sequentially in Q2FY27. The presentation reports H1FY27 whole-bank NIM of 2.90%, 2 basis points below H1FY26, and H1FY27 total provisions of ₹23,596 crore, up 2.02% year on year.