










SBI Q2FY27 profit rises 14% as loan-loss provisions fall
Key highlights
- SBI reported Q2FY27 profit after tax of Rs 23,038 crore, up 14.28% year on year.
- SBI's Q2FY27 NII rose 14.69% to Rs 49,143 crore, while loan-loss provisions fell 33.23% to Rs 2,759 crore.
- SBI's gross advances increased 17.84% year on year to Rs 52,08,344 crore at September 2026.
- SBI's GNPA ratio improved to 1.39%, while Q2FY27 credit cost declined to 0.22%.
powered by IRIS
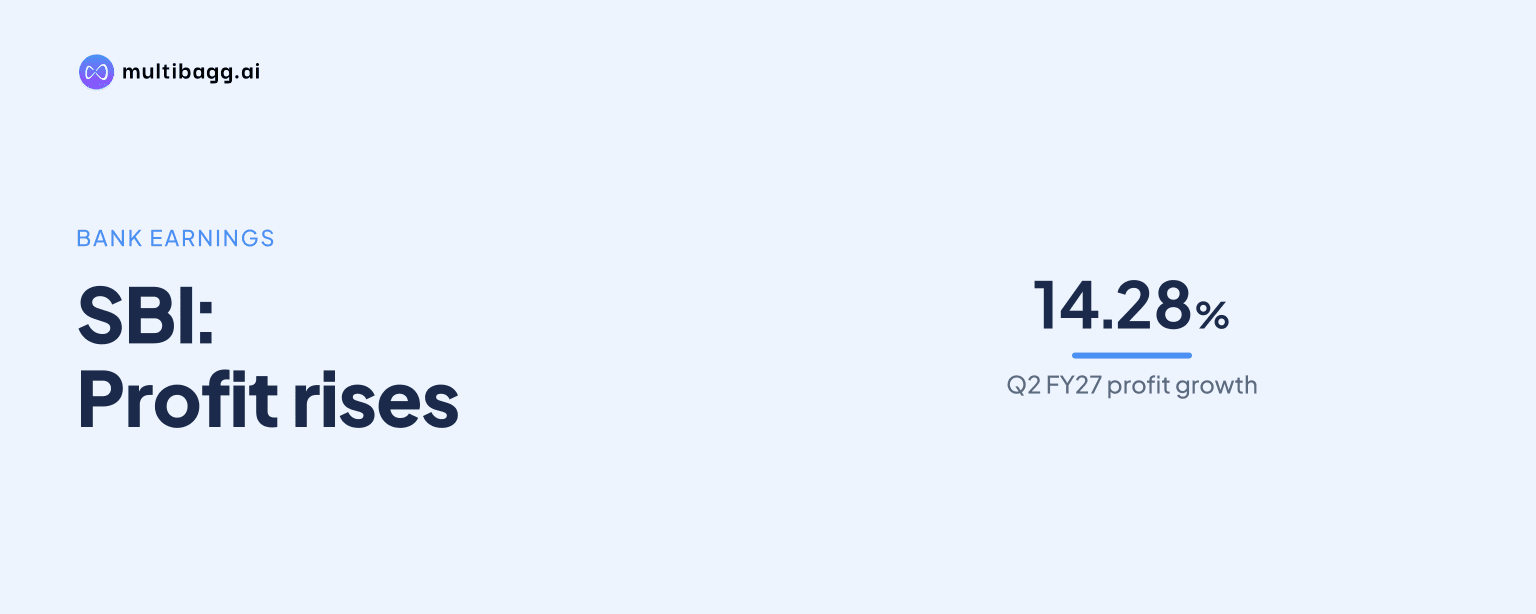
State Bank of India reported profit after tax of Rs 23,038 crore in Q2FY27, up 14.28% year on year, as net interest income rose 14.69% to Rs 49,143 crore and loan-loss provisions fell 33.23% to Rs 2,759 crore. Operating profit increased 7.28% to Rs 34,226 crore.
Know State Bank of India inside out
Results, valuation, peers and who's buying, in one view.
How did SBI's Q2FY27 profit change?
SBI's profit after tax rose to Rs 23,038 crore in Q2FY27 from Rs 20,166 crore in Q2FY26, and was 9.07% above Rs 21,121 crore in Q1FY27. Operating profit increased 7.28% year on year to Rs 34,226 crore, showing that pre-provision earnings also increased during the quarter.
Net interest income, or NII, increased faster than both interest income and interest expenses in Q2FY27. Interest income rose 10.46% year on year to Rs 1,32,019 crore, while interest expenses increased 8.09% to Rs 82,876 crore, resulting in NII of Rs 49,143 crore. NII was also 4.58% above the Rs 46,992 crore reported in Q1FY27.
What happened to SBI's margins in Q2FY27?
SBI's whole-bank net interest margin, or NIM, was 2.94% in Q2FY27, 8 basis points higher than in Q1FY27, while domestic NIM rose 11 basis points sequentially to 3.11%. A basis point is one-hundredth of a percentage point. Domestic NIM was also 3 basis points above the 3.08% reported in Q2FY26.
For H1FY27, SBI reported whole-bank NIM of 2.90% and domestic NIM of 3.06%, compared with domestic NIM of 3.04% in H1FY26. Half-year NII grew 14.78% to Rs 96,135 crore from Rs 83,754 crore, while interest income rose 9.51% to Rs 2,59,915 crore and interest expenses increased 6.63% to Rs 1,63,780 crore.
The margin data came alongside a change in the deposit mix. Domestic current account and savings account deposits, commonly called CASA deposits, grew 8.13% year on year to Rs 22,96,883 crore at September 2026, while domestic term deposits increased 14.26% to Rs 36,97,717 crore. The CASA ratio was 38.32%, down 131 basis points from 39.63% a year earlier and 92 basis points from 39.24% in June 2026.
Which SBI loan segments drove balance-sheet growth?
SBI's gross advances reached Rs 52,08,344 crore at September 2026, up 17.84% year on year and 3.19% quarter on quarter. Domestic advances grew 16.94% year on year, while foreign offices' advances rose 22.86% in rupee terms and 13.84% in dollar terms. Deposits stood at Rs 62,77,919 crore, increasing 12.27% year on year and 4.53% from June 2026.
Agriculture advances were the fastest-growing disclosed retail, agriculture and micro, small and medium enterprise, or RAM, category, rising 22.64% year on year. Small and medium enterprise advances grew 21.97%, while RAM advances overall grew 17.34%. Retail personal advances increased 14.54% to Rs 18,25,083 crore, including home loans, which grew 11.94% to Rs 9,85,537 crore.
Corporate advances increased 16.12% year on year to Rs 14,39,156 crore at September 2026, while their 1.30% sequential increase was below the 2.93% increase in retail personal advances. SBI also reported retail term-deposit growth of 16.74% year on year. Gross advances grew 5.57 percentage points faster than deposits on a year-on-year basis.
Got a follow-up? Ask IRIS
Did SBI's asset quality improve in Q2FY27?
SBI's asset-quality ratios improved in Q2FY27, with the gross non-performing asset, or GNPA, ratio at 1.39%, down 34 basis points year on year and 8 basis points sequentially. The net non-performing asset ratio was 0.36%, improving by 6 basis points from Q2FY26 and by 2 basis points from Q1FY27. GNPAs declined to Rs 72,529 crore at September 2026 from Rs 76,243 crore a year earlier.
Loan-loss provisions fell to Rs 2,759 crore, down 33.23% year on year from Rs 4,132 crore and 17.86% from Rs 3,359 crore in Q1FY27. Credit cost was 0.22%, compared with 0.39% in Q2FY26 and 0.27% in Q1FY27. The reduction in provisioning accompanied the 14.28% increase in profit after tax.
The Q2FY27 slippage ratio, which measures loans newly turning non-performing, was 0.41%, compared with 0.45% a year earlier and 0.57% in Q1FY27. SBI reported a provision coverage ratio of 74.43%, or 91.83% including accounts under collection, abbreviated as AUCA. Net non-performing assets were Rs 18,546 crore, 3.20% below the Rs 19,158 crore reported in June 2026.
What capital and return metrics did SBI report?
SBI reported a capital-to-risk-weighted-assets ratio, or CRAR, of 16.09% at the end of Q2FY27, up 42 basis points from 15.67% in June 2026 and 147 basis points from 14.62% a year earlier. Its common equity Tier 1 ratio was 13.34%, compared with 12.89% in Q1FY27, and the Tier 1 ratio increased to 14.34% from 13.90%.
For H1FY27, SBI reported return on assets of 1.14% and return on equity of 18.68%. Half-year operating profit rose 8.50% to Rs 67,755 crore, profit after tax increased 12.31% to Rs 44,159 crore, and loan-loss provisions declined 32.52% to Rs 6,118 crore. These half-year figures included NII growth of 14.78%.
Conclusion
SBI's Q2FY27 earnings increase reflected multiple reported movements: NII rose 14.69%, operating profit increased 7.28%, and loan-loss provisions declined 33.23%. Gross advances expanded 17.84% year on year, while the GNPA ratio declined to 1.39% and credit cost fell to 0.22%.
What to watch next is whether the difference between 17.84% gross-advance growth and 12.27% deposit growth persists, and whether the 38.32% CASA ratio changes after declining 131 basis points year on year. The release disclosed no management earnings target, plan or scheduled future event.