










Sigachi FY26 operating cash flow turns negative as interest cover falls
Key highlights
- Sigachi’s operating cash flow turned negative at Rs 4.3 crore in FY26, versus an inflow of Rs 26.9 crore in FY25.
- Sigachi’s EBITDA fell to Rs 53.7 crore in FY26 from Rs 112 crore, while EBITDA margin declined to 11.2% from 22.4%.
- Sigachi’s interest coverage ratio dropped to 3.19 in FY26 from 5.56 in FY25, the lowest level in the FY22-FY26 series.
- Sigachi’s current borrowings rose to Rs 135.6 crore in FY26 and reached Rs 150.2 crore at H1 FY27, while trade receivables increased to Rs 234.1 crore.
powered by IRIS
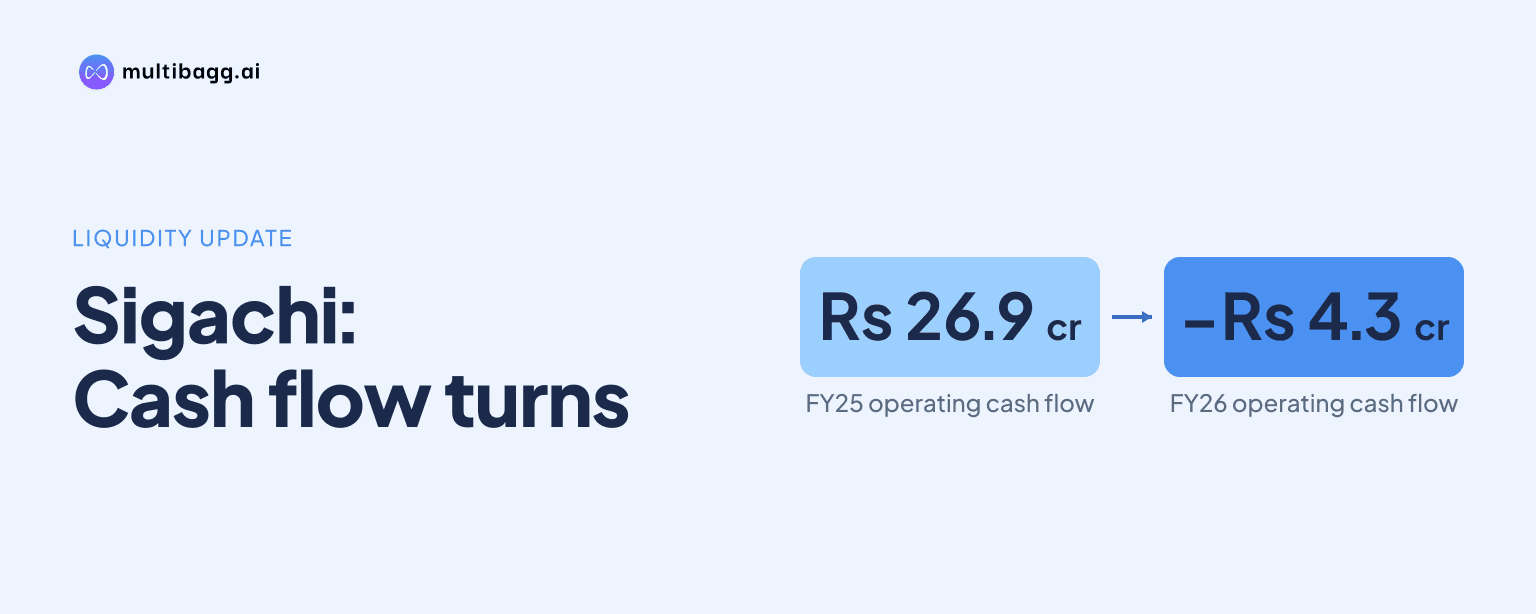
Sigachi Industries Ltd reported an operating cash outflow of Rs 4.3 crore in FY26, compared with an inflow of Rs 26.9 crore in FY25. Sigachi’s interest coverage ratio fell to 3.19 from 5.56, while current borrowings rose to Rs 135.6 crore from Rs 118.1 crore and reached Rs 150.2 crore at H1 FY27.
Know Sigachi Industries inside out
Results, valuation, peers and who's buying, in one view.
What changed in Sigachi’s FY26 operating cash flow?
Sigachi moved from positive operating cash generation to an operating cash outflow in FY26. Cash flows from operations were an outflow of Rs 4.3 crore, against inflows of Rs 26.9 crore in FY25, Rs 12.9 crore in FY24, Rs 29 crore in FY23 and Rs 5.9 crore in FY22. FY26 was the only negative result in the five-year cash-flow series shown in the presentation.
The cash-flow reversal coincided with lower reported operating profitability. Revenue was Rs 486.1 crore in FY26, down from Rs 508.8 crore in FY25, while earnings before interest, tax, depreciation and amortisation, or EBITDA, declined to Rs 53.7 crore from Rs 112 crore. EBITDA margin reduced to 11.2% from 22.4%, and profit after tax before exceptional items fell to Rs 35.4 crore from Rs 70.3 crore.
Sigachi spent Rs 41.2 crore on capex in FY26, following Rs 43.3 crore in FY25. The combination of an operating cash outflow and capex means the disclosed FY26 operating cash flow did not cover the reported investment amount. Gross block, representing the historical cost of fixed assets before depreciation, decreased to Rs 298.1 crore in FY26 from Rs 345.6 crore in FY25.
How far did Sigachi’s interest coverage fall in FY26?
Sigachi’s interest coverage ratio fell to 3.19 in FY26 from 5.56 in FY25. It was 45.31 in FY22, 13.68 in FY23 and 9.82 in FY24, making FY26 the lowest reading in the FY22-FY26 series. The year-on-year decline was 2.37 points.
Finance costs increased to Rs 13.9 crore in FY26 from Rs 12.4 crore in FY25, while EBITDA fell to Rs 53.7 crore from Rs 112 crore. Depreciation and amortisation rose to Rs 17.6 crore from Rs 15.8 crore. Profit before exceptional items decreased to Rs 30.5 crore from Rs 92.3 crore over the same period.
Sigachi’s net debt-to-equity ratio rose to 0.21 in FY26 from 0.04 in FY25. The ratio was 0.13 in FY24 and 0.03 in FY23, compared with negative 0.15 in FY22. Total equity declined to Rs 528.9 crore in FY26 from Rs 613.1 crore, while current liabilities increased to Rs 270.5 crore from Rs 185.2 crore.
Got a follow-up? Ask IRIS
Which items increased Sigachi’s short-term funding needs?
Sigachi’s current borrowings increased to Rs 135.6 crore in FY26 from Rs 118.1 crore in FY25. They had been Rs 92.4 crore in FY24 and Rs 39.5 crore in FY23. At H1 FY27, current borrowings were Rs 150.2 crore, or Rs 14.6 crore above the FY26 position.
Trade receivables rose to Rs 224.2 crore in FY26 from Rs 183.7 crore in FY25, while inventories declined to Rs 73.6 crore from Rs 94.3 crore. Cash and cash equivalents increased to Rs 20.9 crore from Rs 17.3 crore, but bank balances other than cash equivalents fell to Rs 5.1 crore from Rs 54.7 crore. The presentation does not provide a working-capital bridge for the change in operating cash flow.
Other current liabilities increased to Rs 70.3 crore in FY26 from Rs 26.1 crore in FY25, and trade payables rose to Rs 58.8 crore from Rs 35.7 crore. Together with current borrowings, these categories contributed to the Rs 85.3 crore increase in current liabilities. Total liabilities rose to Rs 312.3 crore from Rs 233.2 crore, although non-current liabilities declined to Rs 41.8 crore from Rs 48 crore.
Has Sigachi reported a cash-flow recovery in H1 FY27?
Sigachi has not reported H1 FY27 operating cash flow in the supplied presentation. Its cash-flow table ends with FY26, while the H1 FY27 disclosures cover the income statement and balance sheet. As a result, the available data do not establish whether operating cash conversion recovered after the FY26 outflow of Rs 4.3 crore.
H1 FY27 EBITDA was Rs 35.6 crore on operational revenue of Rs 251.7 crore, producing an EBITDA margin of 14.14%. That margin was above FY26’s 11.24% and below FY25’s 22.38%. Finance costs were Rs 6.9 crore, profit before exceptional items was Rs 21.1 crore, and profit after tax was Rs 16.9 crore in H1 FY27.
The H1 FY27 balance sheet shows current liabilities of Rs 288.8 crore, compared with Rs 270.5 crore at FY26, alongside current borrowings of Rs 150.2 crore. Trade receivables reached Rs 234.1 crore and inventories were Rs 95.1 crore. Sigachi did not disclose H1 FY27 capex or interest coverage, so neither investment cash requirements nor debt-servicing coverage can be assessed for the half year.
Conclusion
Sigachi’s FY26 disclosures show lower operating cash generation alongside reduced debt-servicing coverage. Operating cash flow changed from an inflow of Rs 26.9 crore to an outflow of Rs 4.3 crore, EBITDA declined from Rs 112 crore to Rs 53.7 crore, and interest coverage fell from 5.56 to 3.19. Current borrowings increased by Rs 17.5 crore to Rs 135.6 crore.
The next measure to watch is whether Sigachi discloses operating cash flow, capex and interest coverage for periods after FY26. H1 FY27 showed an EBITDA margin of 14.14%, above FY26’s 11.24%, but also current borrowings of Rs 150.2 crore and receivables of Rs 234.1 crore. The presentation leaves the cash-conversion and coverage outcome for H1 FY27 unresolved.