










Sigachi Industries Q2 EBITDA rose 156% as PAT declined
Key highlights
- Sigachi Industries’ Q2 FY27 EBITDA rose 156% year-on-year to Rs 19.2 crore, while EBITDA margin expanded to 14.72%.
- Q2 FY27 revenue from operations increased 18.09% year-on-year to Rs 130.5 crore, compared with an 8.05% rise in total expenses to Rs 111.3 crore.
- Q2 FY27 PAT declined 15.24% year-on-year to Rs 8.9 crore as other income fell to Rs 0.2 crore and finance cost rose to Rs 3.8 crore.
- MCC accounted for 70% of disclosed Q2 FY27 revenue, up from 60% in Q2 FY26, while the company operates four facilities with combined capacity of 18,000 metric tonnes per annum.
powered by IRIS
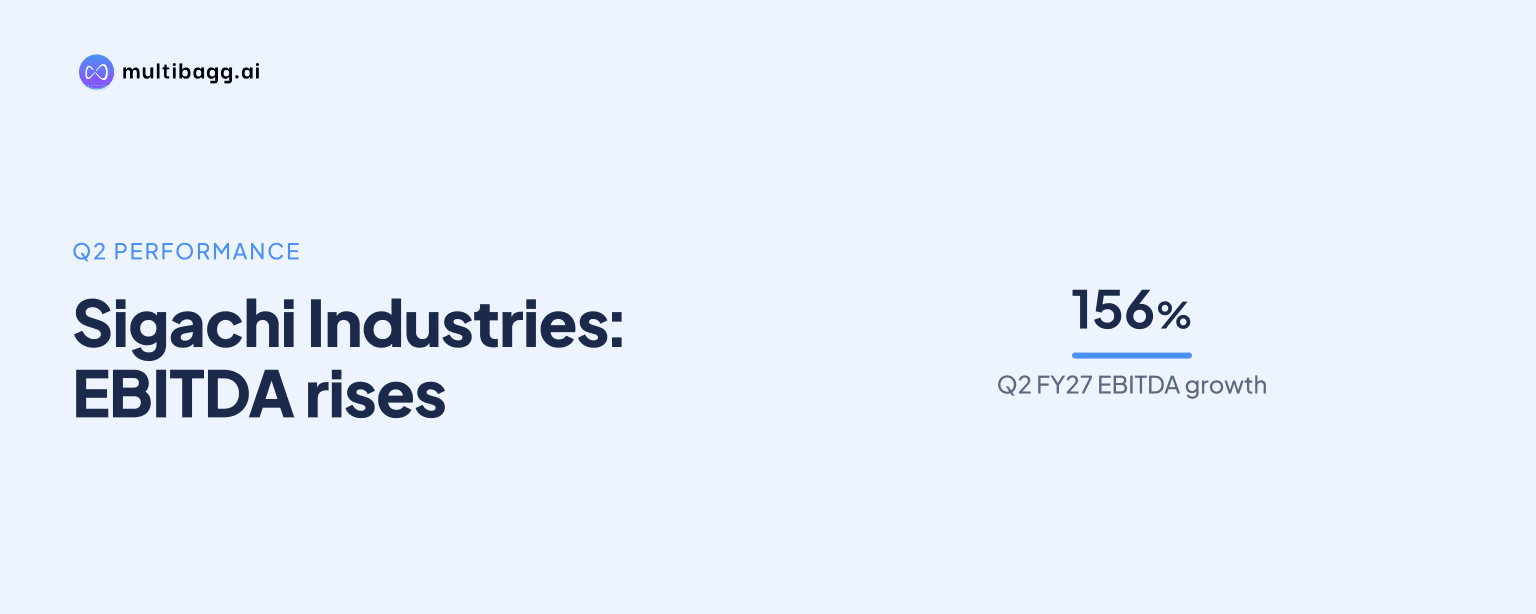
Sigachi Industries Ltd reported Q2 FY27 EBITDA of Rs 19.2 crore, up 156% year-on-year, as revenue from operations rose 18.09% to Rs 130.5 crore and the EBITDA margin reached 14.72%. Reported profit after tax, however, fell 15.24% to Rs 8.9 crore from Rs 10.5 crore.
Know Sigachi Industries inside out
Results, valuation, peers and who's buying, in one view.
Why did Sigachi Industries’ Q2 EBITDA rise 156% year-on-year?
Sigachi Industries’ Q2 FY27 EBITDA rose 156% because revenue from operations increased faster than total expenses. Revenue grew 18.09% year-on-year to Rs 130.5 crore, while total expenses increased 8.05% to Rs 111.3 crore, resulting in EBITDA of Rs 19.2 crore compared with Rs 7.5 crore in Q2 FY26.
EBITDA margin reached 14.72% in Q2 FY27, up 794 basis points from 6.78% in Q2 FY26. A basis point is one-hundredth of a percentage point. The margin was also 112 basis points above the 13.60% reported in Q1 FY27, when EBITDA was Rs 16.5 crore on revenue of Rs 121.3 crore.
The sequential comparison also shows operating income rising 7.58% from Q1 FY27 to Q2 FY27, while EBITDA rose 16.36%. Total expenses increased 6.20% quarter-on-quarter to Rs 111.3 crore from Rs 104.8 crore, below the rate of revenue growth, while EBITDA margin rose from 13.60% to 14.72%.
Why did Sigachi Industries’ PAT fall despite higher EBITDA?
Sigachi Industries’ reported PAT fell despite higher EBITDA, with Q2 FY27 PAT at Rs 8.9 crore versus Rs 10.5 crore a year earlier. The presentation records other income of Rs 0.2 crore in Q2 FY27, down from Rs 2.5 crore in Q2 FY26, while finance cost increased to Rs 3.8 crore from Rs 3.1 crore.
The prior-year comparison also includes an exceptional item of Rs 4.7 crore in Q2 FY26, while no exceptional item is listed for Q2 FY27. Profit before exceptional items was Rs 11.2 crore in Q2 FY27, compared with Rs 2.8 crore a year earlier, a reported increase of 300%; reported profit before tax was Rs 11.2 crore, up 51.35% from Rs 7.4 crore.
Tax expense was Rs 2.3 crore in Q2 FY27, compared with Rs 3.1 crore in Q2 FY26. The presentation reports the year-on-year PAT decline alongside the exceptional-item difference, lower other income and higher finance cost, but does not give a separate reconciliation of the movement between reported profit before tax and PAT.
Sequentially, PAT improved 8.53% to Rs 8.9 crore from Rs 8.2 crore in Q1 FY27. PAT margin rose by 6 basis points from 6.76% to 6.82% quarter-on-quarter, but remained 277 basis points below the 9.59% margin reported for Q2 FY26.
How did Sigachi Industries’ H1 FY27 performance compare?
Sigachi Industries’ H1 FY27 revenue from operations increased 5.45% year-on-year to Rs 251.7 crore, while EBITDA rose 12.66% to Rs 35.6 crore. EBITDA margin was 14.14%, an increase of 90 basis points from 13.24% in H1 FY26, as total expenses rose 4.34% to Rs 216.1 crore.
The first-half comparison changes materially when exceptional items are included. Profit before exceptional items declined 7.45% to Rs 21.1 crore from Rs 22.8 crore, while the presentation lists an exceptional item of negative Rs 116.3 crore in H1 FY26 and none in H1 FY27. This resulted in reported H1 FY27 profit before tax of Rs 21.1 crore, compared with a loss before tax of Rs 93.5 crore a year earlier.
Reported H1 FY27 PAT was Rs 16.9 crore, compared with a loss of Rs 90.4 crore in H1 FY26, and PAT margin was 6.71% versus negative 37.87%. Depreciation and amortisation was unchanged at Rs 8.8 crore across both half-year periods, while finance cost increased to Rs 6.9 crore from Rs 6.4 crore.
Other income was Rs 1.2 crore in H1 FY27, compared with Rs 6.4 crore in H1 FY26. Total comprehensive income was Rs 17.9 crore in H1 FY27, following a total comprehensive loss of Rs 90.6 crore in the prior-year half, while basic earnings per share were Rs 0.44 compared with negative Rs 2.35.
Got a follow-up? Ask IRIS
Which businesses accounted for Sigachi Industries’ Q2 revenue?
Sigachi Industries’ microcrystalline cellulose, or MCC, business accounted for the largest disclosed share of Q2 FY27 revenue at 70%, compared with 60% in Q2 FY26. The 10-percentage-point rise means MCC represented a larger portion of the Rs 130.5 crore Q2 FY27 revenue base than in the preceding-year quarter.
The remaining disclosed revenue shares declined or were broadly stable. Operations and Management accounted for 11% in Q2 FY27 versus 12% in Q2 FY26, active pharmaceutical ingredients, or API, represented 13% versus 17%, and Allied Trades represented 7% versus 11%.
Sigachi Industries operates four manufacturing facilities in Jhagadia, Dahej, Sultanpur and Raichur, with combined operating capacity of 18,000 metric tonnes per annum. The company states that it offers more than 100 products and serves more than 500 customers across over 65 countries.
What is Sigachi Industries planning after Q2 FY27?
Sigachi Industries says it is expanding its API product portfolio and has Certificate of Suitability, or CEP, filings in the pipeline. Its presentation identifies pharma excipients, pharma API and intermediates, film coatings, nutraceutical coatings and polymer blends as parts of its presence across the pharmaceutical ecosystem.
Management says it is moving up the value chain by introducing value-added and margin-accretive products in its product basket. The presentation does not state a financial target or timetable for the API portfolio expansion, CEP filings, film coatings, nutraceutical coatings or polymer blends.
The company reports five-year compound annual growth rates of 19.92% for revenue, 6.74% for EBITDA and 3.16% for PAT before exceptional items. These historical measures sit alongside the stated 18,000-metric-tonne annual operating capacity and the Q2 FY27 revenue mix in which MCC supplied 70% of disclosed revenue contribution.
Conclusion
Sigachi Industries’ Q2 FY27 results show a divergence between operating earnings and reported net profit. Revenue rose to Rs 130.5 crore, EBITDA reached Rs 19.2 crore and EBITDA margin expanded 794 basis points year-on-year, while PAT fell to Rs 8.9 crore amid lower other income, higher finance cost and a prior-year exceptional-item comparison.
The next results will show whether the Q2 margin movement continues and whether MCC remains at 70% of disclosed revenue contribution. Management’s disclosed API portfolio expansion, CEP filing pipeline and planned introduction of value-added products are the identified initiatives to watch, although the presentation gives no timetable or financial target for them.