










Signature Global H1 adjusted EBITDA margin doubles; PAT positive
Key highlights
- Signature Global’s adjusted EBITDA margin rose to 13.1% in H1’FY27 from 6.4% in H1’FY26.
- Signature Global reported H1’FY27 PAT of Rs 50 crore, compared with a Rs 10 crore loss a year earlier.
- Signature Global’s net debt was Rs 450 crore on September 30, 2026, versus Rs 200 crore on March 31, 2026.
- Mid-income housing contributed Rs 1,040 crore, or 77%, of Signature Global’s Rs 1,370 crore revenue recognised from operations.
powered by IRIS
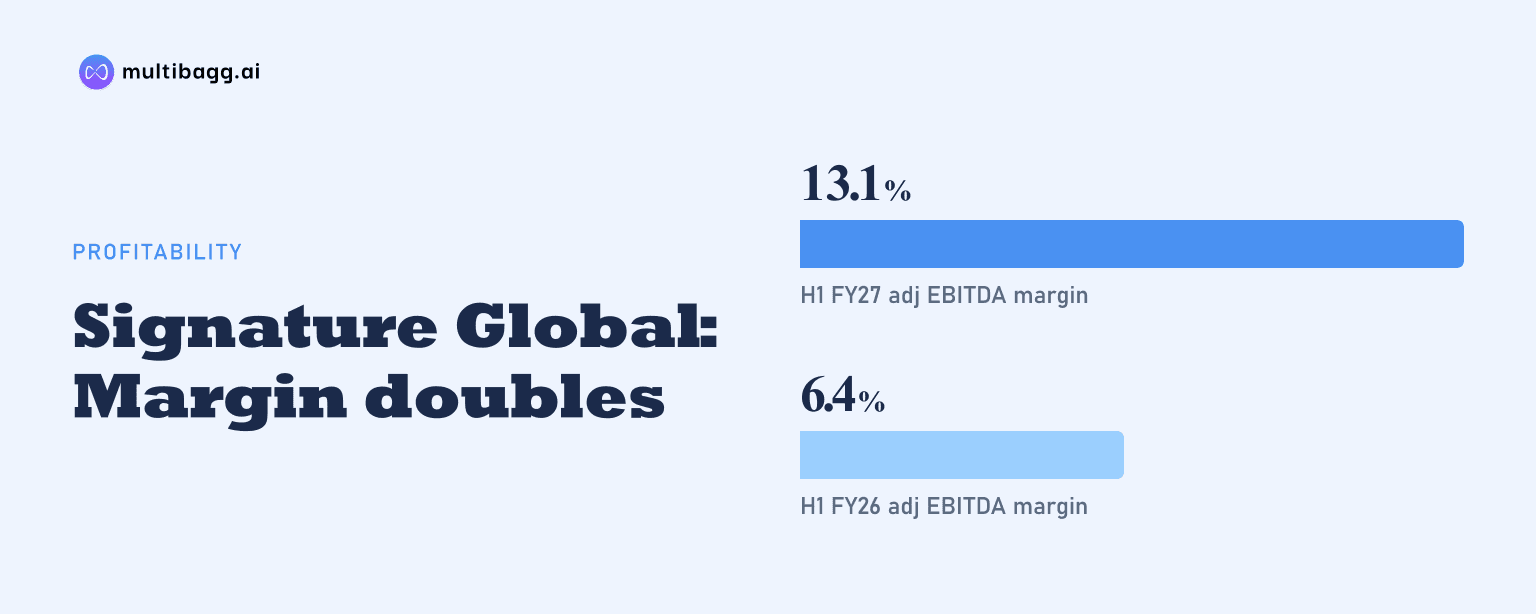
Signature Global reported a 13.1% adjusted EBITDA margin in H1’FY27, more than double H1’FY26’s 6.4%, as adjusted EBITDA reached Rs 180 crore and profit after tax turned to Rs 50 crore from a Rs 10 crore loss. Net debt, however, rose to Rs 450 crore on September 30, 2026, from Rs 200 crore at March-end.
Know SignatureGlobal India inside out
Results, valuation, peers and who's buying, in one view.
How did Signature Global’s H1’FY27 profitability change?
Signature Global increased total revenue by 14% year on year to Rs 1,370 crore in H1’FY27 from Rs 1,200 crore in H1’FY26, while adjusted gross profit rose 23% to Rs 420 crore from Rs 340 crore. The adjusted gross margin increased to 31.0% from 29.0%, a 2.0-percentage-point change. Management attributed higher revenue recognition to completion of more projects, with 1.60 million square feet of area recognised during the half year.
Revenue from real-estate properties was Rs 1,340 crore, compared with Rs 1,170 crore a year earlier. Mid-income housing generated Rs 1,040 crore, up from Rs 790 crore, and contributed 77% of the Rs 1,370 crore revenue recognised from operations. Affordable housing generated Rs 300 crore, down from Rs 380 crore, and represented the remaining 23% disclosed by Signature Global.
The profit after tax, or PAT, comparison marks a move from a Rs 10 crore loss in H1’FY26 to a Rs 50 crore profit in H1’FY27. PAT margin changed to 3.6% from negative 1.0%. Other operating revenue and income was Rs 130 crore versus Rs 80 crore, while employee cost fell to Rs 120 crore from Rs 140 crore and selling, general and administrative expense rose to Rs 230 crore from Rs 170 crore.
Why did Signature Global’s adjusted EBITDA margin rise to 13.1%?
Signature Global’s adjusted EBITDA margin rose to 13.1% as adjusted EBITDA increased to Rs 180 crore in H1’FY27 from Rs 80 crore in H1’FY26, when the margin was 6.4%. The Rs 100 crore increase in adjusted EBITDA exceeded the Rs 170 crore rise in total revenue, while adjusted gross margin expanded to 31.0% from 29.0%.
For the H1’FY27 13.1% measure, Signature Global defines adjusted EBITDA as earnings before interest, taxes, depreciation and amortisation, plus finance cost written off through cost of sales and adjustments for gain or loss on fair valuation of derivative instruments and goodwill impairment. The company calculates the margin using revenue from real-estate operations, while adjusted gross profit is calculated as real-estate operating revenue less related cost of sales.
The H1’FY27 margin was also above the 9.3% adjusted EBITDA margin reported for FY26, although the figures cover a half year and a full year respectively. Adjusted gross margin was 29.7% in FY26 and 31.0% in H1’FY27. In the longer series shown by Signature Global, adjusted EBITDA margin was 3.0% in FY22, 13.9% in FY23, 10.8% in FY24 and 14.4% in FY25.
Cost of goods sold rose to Rs 920 crore in H1’FY27 from Rs 840 crore in H1’FY26, below the increase in revenue from real-estate properties from Rs 1,170 crore to Rs 1,340 crore. Other expenses decreased to Rs 20 crore from Rs 30 crore. These reported movements coincide with the increase in gross profit and adjusted EBITDA, but the presentation does not separately quantify each expense line’s contribution to the margin change.
Got a follow-up? Ask IRIS
What caused Signature Global’s net debt to increase?
Signature Global’s net debt increased by Rs 250 crore to Rs 450 crore on September 30, 2026, from Rs 200 crore on March 31, 2026, after land advance and acquisition outflows exceeded operating cash available for growth and debt service. The company defines net debt as current and non-current debt, including trade payables and other financial liabilities, less cash, specified bank balances and current investments.
For H1’FY27, collections were Rs 1,680 crore and other inflows, including goods and services tax and ordinary-course inflows, were Rs 240 crore, producing total cash inflow of Rs 1,920 crore. Construction expense was Rs 880 crore, selling, general and administrative expense was Rs 310 crore, brokerage was Rs 120 crore, and taxes and other outflows were Rs 130 crore. This left Rs 480 crore of operating cash flow available for growth and debt servicing.
Land advance and acquisition then used Rs 550 crore, approval cost used Rs 10 crore and interest payments used Rs 170 crore. The resulting Rs 250 crore increase in net debt matches the movement from Rs 200 crore at March 2026 to Rs 450 crore at September 2026. Signature Global says approval expenses for launched projects are included in construction costs, whereas expenses for upcoming projects are grouped with land acquisition.
How does Signature Global’s debt compare with operating cash surplus?
Signature Global’s Rs 450 crore net debt at September 2026 was higher than the Rs 200 crore recorded at March 2026, but below the Rs 520 crore reported at March 2022 and the Rs 1,160 crore high shown at March 2024. The latest operating-cash-surplus figure disclosed is Rs 2,150 crore for FY26, rather than a September 2026 figure, so the presentation does not provide a directly calculated September debt-to-surplus ratio.
Operating cash surplus is the amount after construction, selling, general and administrative expenses and taxes, adjusted for collections, and before land advance or acquisition. Signature Global aims to keep net debt below 0.5 times projected operating surplus for the ongoing financial year. That threshold is a management aim rather than a reported September 2026 ratio.
CARE reaffirmed the rating on Signature Global’s non-convertible debentures and long-term bank facilities at A+; stable. The lender list includes ICICI Bank, Axis Bank, Standard Chartered, Yes Bank, International Finance Corporation and Tata Capital Housing Finance. The rating reaffirmation does not alter the reported Rs 250 crore half-year increase in net debt.
Conclusion
Taken together, the H1’FY27 figures show a shift in reported profitability alongside higher balance-sheet funding needs: adjusted gross margin rose to 31.0%, PAT moved to Rs 50 crore, and mid-income housing supplied Rs 1,040 crore of recognised revenue. At the same time, Rs 550 crore of land advance and acquisition outflows contributed to net debt rising to Rs 450 crore.
The next measure to watch is progress against management’s aim to keep net debt below 0.5 times projected operating surplus during the ongoing financial year. H1’FY27 generated Rs 480 crore of operating cash flow available for growth and debt service, but interest payments of Rs 170 crore and the land-acquisition outflow exceeded that amount.