










South West Pinnacle FY26 profit nearly quadrupled as leverage eased
Key highlights
- South West Pinnacle's PAT increased from Rs 8.3 crore in FY24 to Rs 33 crore in FY26.
- South West Pinnacle's EBITDA margin rose from 18.52% in FY24 to 23.99% in FY26.
- South West Pinnacle's debt-to-equity ratio fell to 0.27 in H1-FY27 from 0.75 in FY24.
- South West Pinnacle's H1-FY27 PAT increased 23.1% year on year to Rs 13.3 crore.
powered by IRIS
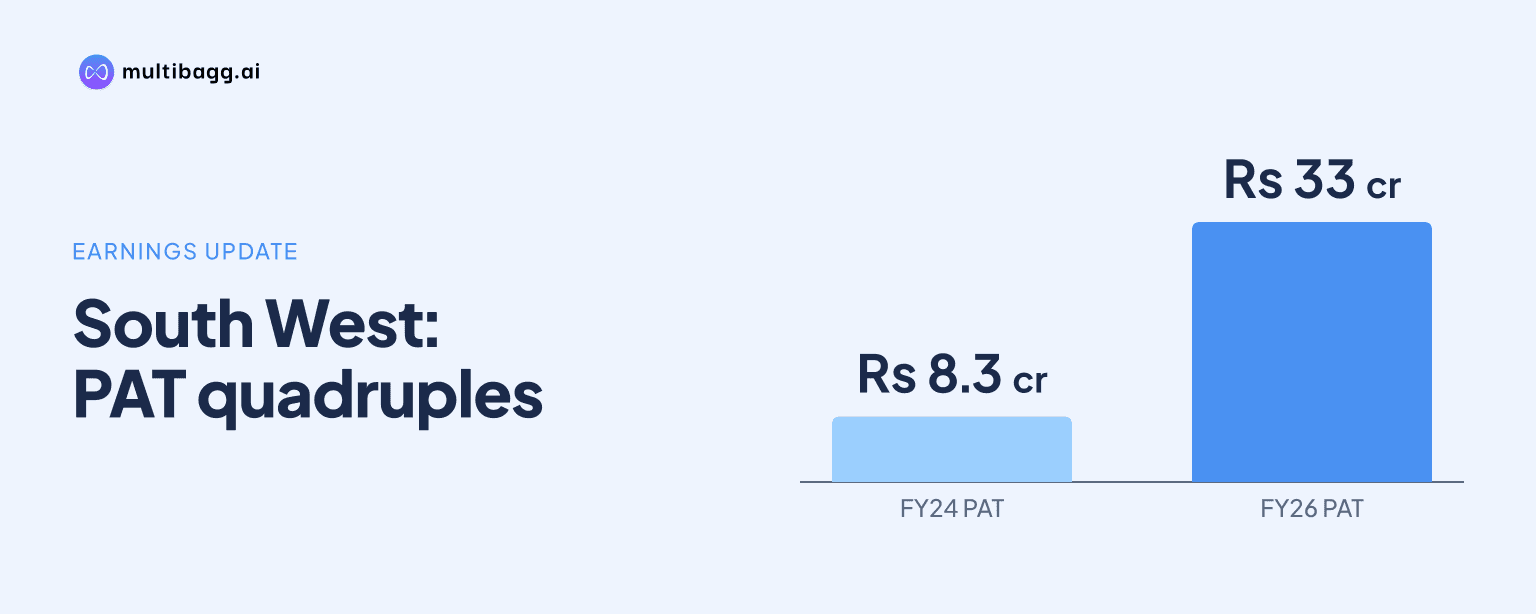
South West Pinnacle Exploration Ltd. lifted consolidated profit after tax, or PAT, to Rs 33 crore in FY26 from Rs 8.3 crore in FY24, a 3.98-times increase, while its debt-to-equity ratio reached 0.27 in H1-FY27. Revenue, margins and net worth also increased over the reported periods.
Know South West Pinnacle Exploration inside out
Results, valuation, peers and who's buying, in one view.
How quickly did South West Pinnacle's earnings grow through FY26?
South West Pinnacle increased revenue from operations from Rs 133.4 crore in FY24 to Rs 243 crore in FY26, while PAT rose from Rs 8.3 crore to Rs 33 crore. Revenue was Rs 180.3 crore in FY25 and PAT was Rs 16.4 crore, showing that profit increased faster than revenue across the two annual comparisons.
Earnings before interest, tax, depreciation and amortisation, or EBITDA, rose from Rs 24.7 crore in FY24 to Rs 33.6 crore in FY25 and Rs 58.3 crore in FY26. Total expenses grew from Rs 108.7 crore to Rs 184.7 crore between FY24 and FY26, while revenue grew by Rs 109.6 crore over the same period, compared with a Rs 76 crore increase in expenses.
Profit before tax, or PBT, increased from Rs 10.9 crore in FY24 to Rs 21.4 crore in FY25 and Rs 43.5 crore in FY26. Diluted earnings per share rose from Rs 2.96 to Rs 5.83 and then Rs 10.82, while other income declined to Rs 3.6 crore in FY26 from Rs 4.8 crore in FY25.
What changed in South West Pinnacle's margins and returns?
South West Pinnacle expanded its EBITDA margin from 18.52% in FY24 to 23.99% in FY26 and its PAT margin from 6.22% to 13.58%. EBITDA margin was broadly unchanged at 18.64% in FY25 before increasing 5.35 percentage points in FY26, while PAT margin increased to 9.10% in FY25 before rising another 4.48 percentage points.
Return on equity, or ROE, increased from 7% in FY24 to 10% in FY25 and 16% in FY26. Return on capital employed, or ROCE, rose from 12% to 16% and then 23% over the same three years, alongside the increase in net worth from Rs 121.5 crore in FY24 to Rs 203.5 crore in FY26.
Finance cost was Rs 8.5 crore in FY24, Rs 8.7 crore in FY25 and Rs 8.4 crore in FY26, despite the expansion in EBITDA. Depreciation increased from Rs 8.8 crore to Rs 11.4 crore between FY24 and FY26, while profit before the share of profit from joint ventures rose from Rs 9.8 crore to Rs 42.1 crore.
Got a follow-up? Ask IRIS
How did South West Pinnacle's leverage and balance sheet change?
South West Pinnacle's reported debt-to-equity ratio declined from 0.75 in FY24 to 0.37 in FY25, increased slightly to 0.39 in FY26 and then fell to 0.27 in H1-FY27. Net worth increased from Rs 121.5 crore in FY24 to Rs 170.6 crore in FY25, Rs 203.5 crore in FY26 and Rs 251.6 crore in H1-FY27.
The H1-FY27 balance sheet showed a shift from short-term to long-term borrowings. Long-term borrowings increased to Rs 22.4 crore from Rs 16 crore at FY26, while short-term borrowings declined to Rs 45.6 crore from Rs 62.6 crore; shareholders' funds rose from Rs 203.5 crore to Rs 251.6 crore.
Total assets increased from Rs 332.1 crore at FY26 to Rs 355.6 crore in H1-FY27. Non-current assets rose by Rs 35.7 crore to Rs 173.5 crore, while current assets declined by Rs 12.2 crore to Rs 182.1 crore, including a decrease in trade receivables from Rs 116.6 crore to Rs 96.7 crore.
What does H1-FY27 say about South West Pinnacle's profit trajectory?
South West Pinnacle reported H1-FY27 revenue of Rs 119.4 crore, EBITDA of Rs 23.2 crore and PAT of Rs 13.3 crore, above Rs 102.7 crore, Rs 20.3 crore and Rs 10.8 crore respectively in H1-FY26. Revenue increased 16.3% year on year, EBITDA increased 14.3% and PAT increased 23.1%, while diluted earnings per share rose to Rs 4.23 from Rs 3.52.
H1-FY27 margins were below the full-year FY26 readings but PAT margin improved from the comparable half year. EBITDA margin was 19.43%, compared with 23.99% in FY26 and 19.77% in H1-FY26, while PAT margin was 11.14%, compared with 13.58% in FY26 and 10.52% in H1-FY26.
The second quarter produced a weaker year-on-year comparison than the first-half result. Q2 FY27 revenue fell 7.5% to Rs 57.7 crore, EBITDA declined 42.8% to Rs 8.3 crore and PAT declined 52.4% to Rs 4 crore; EBITDA margin was 14.38%, versus 23.24% in Q2 FY26.
Conclusion
South West Pinnacle's FY24-to-FY26 record shows profit growth ahead of revenue growth, with PAT rising from Rs 8.3 crore to Rs 33 crore and PAT margin increasing from 6.22% to 13.58%. Net worth rose by Rs 82 crore over the same period, while ROE and ROCE reached 16% and 23%, respectively, in FY26.
The next results will indicate whether H1-FY27 PAT growth of 23.1% can continue while margins move closer to FY26 levels. The presentation discloses no financial target or scheduled operating milestone, leaving the durability of margins following Q2 FY27 EBITDA margin of 14.38% as the principal unresolved matter.