










SPR Auto Technologies debt-to-equity rose to 0.59x in FY26
Key highlights
- SPR Auto Technologies’ standalone debt-to-equity ratio rose to 0.59x in FY26 from 0.15x in FY25 after it issued Rs 1,000 crore of NCDs for the Antolin acquisition.
- FY26 finance costs nearly doubled to Rs 49.5 crore from Rs 24.8 crore, while interest coverage declined to 15.3x from 27.9x.
- FY26 revenue increased to Rs 3,526.6 crore and profit after tax rose to Rs 513.7 crore, but the PAT margin fell to 14.2% from 15.2%.
- SPR reported Rs 121 crore of net operating cash in its Sep-26 statement after working-capital changes used Rs 174.6 crore.
powered by IRIS
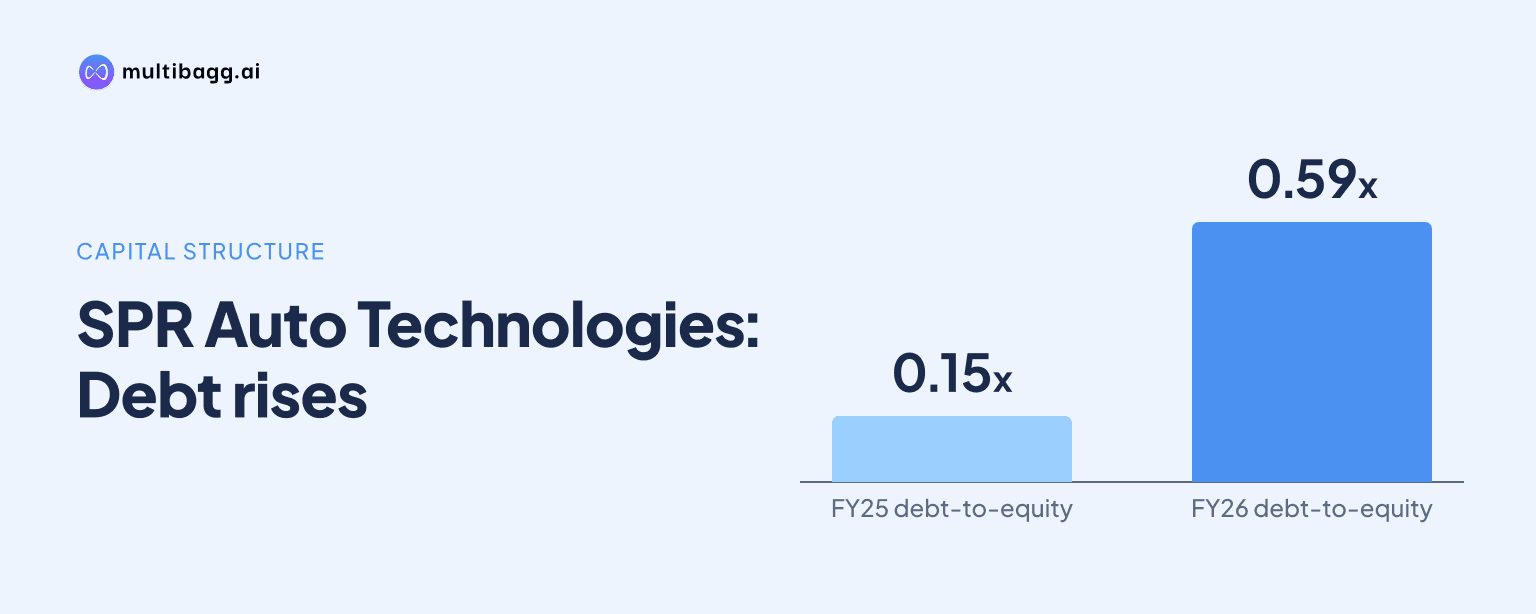
SPR Auto Technologies’ FY26 standalone debt-to-equity ratio rose to 0.59x from 0.15x after it issued Rs 1,000 crore of non-convertible debentures for three Indian entities of Antolin. SPR reported Rs 121 crore of net operating cash in the Sep-26 cash-flow statement, after a Rs 174.6 crore working-capital outflow.
Know SPR Auto Technologies inside out
Results, valuation, peers and who's buying, in one view.
Why did SPR's debt-to-equity ratio increase in FY26?
SPR's standalone debt-to-equity ratio increased because it issued Rs 1,000 crore of non-convertible debentures, or NCDs, for the acquisition of three Indian entities of Antolin in FY26. The ratio rose to 0.59x in FY26 from 0.15x in FY25, after ranging from 0.11x to 0.19x between FY22 and FY25. Management said the ratio would normalise with repayment of the debentures.
The debt increase coincided with changes in servicing and working-capital measures. SPR's interest coverage ratio fell to 15.3x in FY26 from 27.9x in FY25, while the standalone net working-capital cycle increased to 66 days from 65 days. The cycle had been 54 days in FY23, and the consolidated FY26 interest coverage ratio was 13.5x.
How did higher debt affect SPR's FY26 profit measures?
SPR's finance costs nearly doubled to Rs 49.5 crore in FY26 from Rs 24.8 crore in FY25, while revenue from operations increased to Rs 3,526.6 crore from Rs 3,179.5 crore. Earnings before interest, tax, depreciation and amortisation, or EBITDA, increased by Rs 64.5 crore to Rs 843.8 crore, but the EBITDA margin declined to 23.3% from 23.7%.
Profit before tax before exceptional items increased to Rs 705.5 crore in FY26 from Rs 668 crore in FY25, though its margin declined to 19.5% from 20.3%. SPR recorded Rs 23.7 crore of exceptional items in FY26, resulting in profit before tax after exceptional items of Rs 681.8 crore. Profit after tax rose to Rs 513.7 crore from Rs 497.8 crore, while the profit-after-tax margin fell to 14.2% from 15.2%.
Return measures also declined in FY26. Return on equity, or ROE, was 17.8%, compared with 20.7% in FY25, while return on capital employed, or ROCE, was 18.5%, compared with 27.0%. These movements occurred alongside a Rs 347.1 crore increase in revenue from operations between FY25 and FY26.
What changed on SPR's balance sheet by Sep-26?
SPR's total standalone assets increased by Rs 560.7 crore to Rs 5,787.5 crore at Sep-26 from Rs 5,226.8 crore at Mar-26. Current assets rose to Rs 2,507.8 crore from Rs 2,065.3 crore, led by inventories rising to Rs 532.3 crore from Rs 454.1 crore and trade receivables increasing to Rs 616.1 crore from Rs 566.7 crore.
Total equity increased to Rs 4,085.1 crore at Sep-26 from Rs 2,882.1 crore at Mar-26. Other equity accounted for most of the movement, rising to Rs 4,038.7 crore from Rs 2,838.1 crore, while equity share capital increased to Rs 46.4 crore from Rs 44 crore. The presentation reports the balances but does not explain the underlying reason for the increase in other equity.
Reported borrowings changed in composition between the two dates. Non-current borrowings fell to Rs 499 crore at Sep-26 from Rs 1,107.8 crore at Mar-26, while current borrowings increased to Rs 591.2 crore from Rs 580.5 crore. Together, the two borrowing categories totalled Rs 1,090.2 crore at Sep-26, compared with Rs 1,688.3 crore at Mar-26; the presentation does not specify the transactions behind the reduction.
Got a follow-up? Ask IRIS
Why was SPR's Sep-26 operating cash flow lower?
SPR reported Rs 121 crore of net cash from operating activities in the Sep-26 cash-flow statement, compared with Rs 534.6 crore in the Mar-26 statement. Because the statements are labelled Mar-26 and Sep-26, the figures are not presented as like-for-like annual-period results. Within the Sep-26 statement, cash generated from operations was Rs 195.9 crore after a Rs 174.6 crore working-capital outflow.
The principal disclosed operating-cash difference was the working-capital movement. Changes in working capital used Rs 23.6 crore at Mar-26 and Rs 174.6 crore at Sep-26. Tax paid was Rs 74.9 crore at Sep-26, below Rs 168.4 crore at Mar-26, but the lower tax payment did not offset the decline in cash generated from operations.
SPR reported an investing cash outflow of Rs 362.9 crore at Sep-26 and a financing cash inflow of Rs 475.8 crore. This resulted in a Rs 233.8 crore increase in cash and cash equivalents, which SPR defines as cash, bank balances and investments in liquid fixed deposits of up to 12 months. That measure ended at Rs 1,117 crore at Sep-26, compared with Rs 883.2 crore at Mar-26.
Conclusion
SPR's FY26 standalone financials show that the Antolin acquisition financing changed leverage and interest metrics: debt-to-equity rose to 0.59x, interest coverage fell to 15.3x, and finance costs reached Rs 49.5 crore. Revenue, EBITDA and profit after tax increased, but EBITDA, pre-exceptional profit-before-tax and profit-after-tax margins declined from FY25 levels.
The next disclosed development to watch is management's statement that the 0.59x debt-to-equity ratio would normalise as the Rs 1,000 crore NCDs are repaid. The Sep-26 statement also leaves working capital unresolved: inventories and receivables rose to Rs 532.3 crore and Rs 616.1 crore, respectively, while working-capital changes used Rs 174.6 crore of cash.