










Sumax EBITDA CAGR hit 28%, ahead of 6% revenue growth
Key highlights
- Sumax reported EBITDA CAGR of about 28.16% from FY24 to FY26, versus revenue CAGR of about 6.27%.
- Sumax’s FY26 EBITDA was Rs 19.0796 crore, compared with Rs 11.625 crore in FY24.
- Sumax’s PAT margin rose to 8.64% in FY26 from 5.68% in FY24.
- Sumax reported FY26 ROE of 23.10% and ROCE of 23.86% on a six-month, non-annualised basis.
powered by IRIS
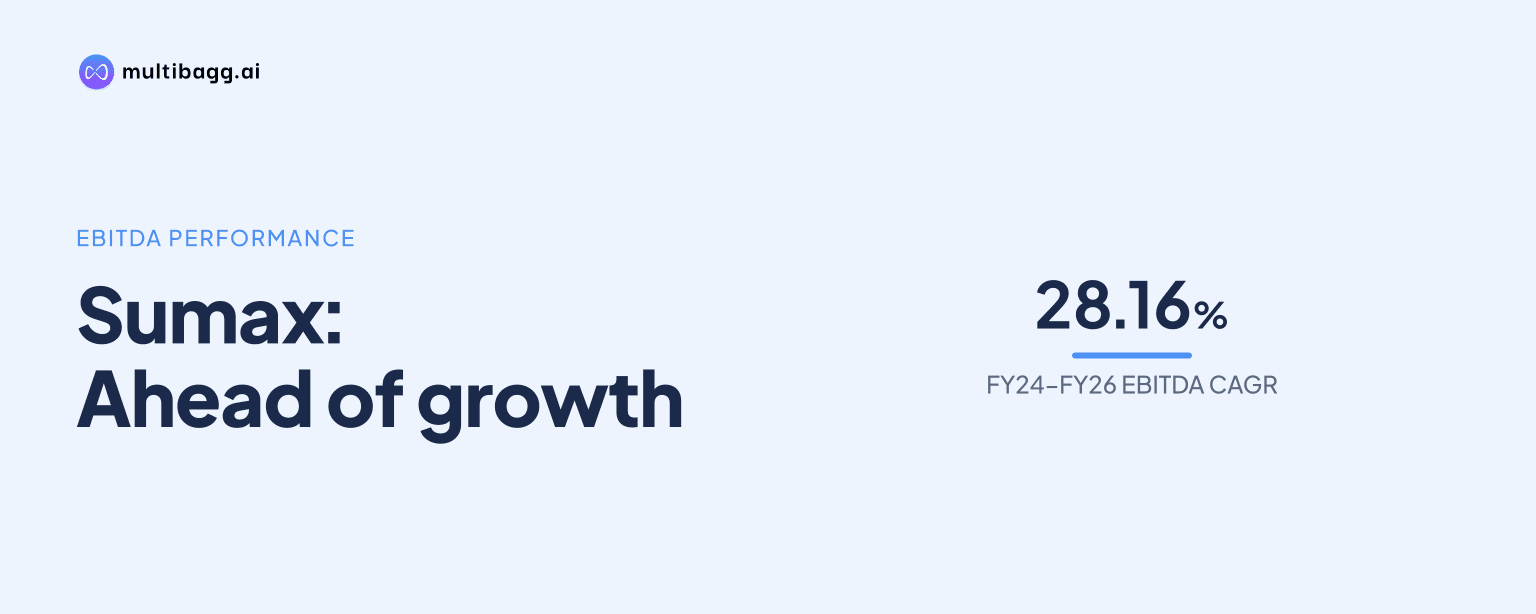
Sumax Engineering Limited reported EBITDA compound annual growth of about 28.16% from FY24 to FY26, ahead of revenue CAGR of about 6.27%, as EBITDA rose from Rs 11.625 crore to Rs 19.0796 crore. The presentation says FY24-FY26 financial figures are based on six-month financials and are not annualised.
Know Sumax Engineering inside out
Results, valuation, peers and who's buying, in one view.
Why did Sumax’s EBITDA grow faster than revenue?
Sumax’s reported EBITDA grew by Rs 7.4546 crore between FY24 and FY26, while revenue from operations increased by Rs 16.8961 crore over the same period. Revenue rose from Rs 130.7945 crore in FY24 to Rs 146.126 crore in FY25 and Rs 147.6906 crore in FY26. The FY25-to-FY26 revenue increase of Rs 1.5646 crore was smaller than the Rs 15.3315 crore increase reported between FY24 and FY25.
EBITDA, or earnings before interest, tax, depreciation and amortisation, increased in both reported comparisons. It rose from Rs 11.625 crore in FY24 to Rs 15.0266 crore in FY25 and Rs 19.0796 crore in FY26. The presentation reports EBITDA CAGR of about 28.16% for FY24-FY26, against revenue CAGR of about 6.27%, but does not provide a component-wise operating-expense split to identify the cost mechanism behind the difference.
How did Sumax’s PAT and margin change?
Sumax’s profit after tax, or PAT, rose from Rs 7.4314 crore in FY24 to Rs 12.7586 crore in FY26, representing reported CAGR of about 31.16%. PAT increased by Rs 2.5502 crore to Rs 9.9816 crore in FY25, followed by a Rs 2.777 crore increase in FY26. This reported PAT growth rate exceeded the presentation’s EBITDA CAGR of 28.16% and revenue CAGR of 6.27% across FY24-FY26.
The reported PAT margin increased by 2.96 percentage points to 8.64% in FY26 from 5.68% in FY24. It was 6.83% in FY25, up 1.15 percentage points from FY24, before increasing another 1.81 percentage points in FY26. Profit before tax rose from Rs 10.0195 crore in FY24 to Rs 13.4379 crore in FY25 and Rs 17.2396 crore in FY26, while interest cost was Rs 60.82 lakh, Rs 56.75 lakh and Rs 57.19 lakh, respectively.
What happened to Sumax’s returns and per-share measures?
Sumax reported return on equity, or ROE, of 23.10% in FY26, compared with 21.14% in FY24 and 22.76% in FY25. Return on capital employed, or ROCE, was 23.86% in FY26, against 23.34% in FY24 and 24.64% in FY25. ROE therefore increased by 1.96 percentage points from FY24 to FY26, while ROCE ended 0.52 percentage points above its FY24 level after declining from FY25.
Earnings per share increased from Rs 5.04 in FY24 to Rs 6.78 in FY25 and Rs 8.66 in FY26. Net asset value per share also rose, from Rs 26.39 to Rs 33.16 and then Rs 41.83. The presentation explicitly states that ratios including ROE, ROCE, earnings per share and net asset value per share are based on six-month financials and are not annualised.
Got a follow-up? Ask IRIS
How did Sumax’s debt and liquidity ratios move?
Sumax’s debt-to-equity ratio was 0.21 times in FY26, compared with 0.17 times in FY24 and 0.16 times in FY25. The ratio increased by 0.05 times from FY25 even as total equity rose from Rs 48.5564 crore to Rs 61.615 crore. The FY26 balance sheet also reported non-current liabilities of Rs 8.3878 crore, up from Rs 1.5006 crore in FY25.
The current ratio was 3.42 times in FY26, compared with 3.28 times in FY24 and 3.67 times in FY25. Current assets declined to Rs 50.7084 crore in FY26 from Rs 57.8725 crore in FY25, while current liabilities decreased to Rs 14.8104 crore from Rs 15.5781 crore. The FY26 ratio was therefore above the FY24 reading but below FY25, on the presentation’s stated six-month basis.
What changed in Sumax’s FY26 income statement and balance sheet?
Sumax reported total income of Rs 148.3445 crore in FY26, compared with Rs 147.1832 crore in FY25 and Rs 131.5407 crore in FY24. Reported total operating expenses were Rs 146.4356 crore in FY26, Rs 132.09 crore in FY25 and Rs 119.845 crore in FY24. The FY26 increase in reported operating expenses was Rs 14.3456 crore, while total income increased by Rs 1.1613 crore from FY25.
Depreciation and amortisation rose to Rs 1.337 crore in FY26 from Rs 1.0878 crore in FY25 and Rs 1.068 crore in FY24. Total assets increased to Rs 84.8132 crore in FY26 from Rs 66.1351 crore in FY25 and Rs 54.0009 crore in FY24. Non-current assets were Rs 34.1048 crore in FY26 versus Rs 8.2626 crore in FY25, while current assets declined by Rs 7.1641 crore year on year.
Conclusion
Sumax’s FY24-FY26 presentation shows reported earnings growing faster than revenue on a six-month, non-annualised basis. EBITDA CAGR was about 28.16%, PAT CAGR was about 31.16%, and revenue CAGR was about 6.27%, while PAT margin rose from 5.68% to 8.64% and FY26 ROE and ROCE were 23.10% and 23.86%, respectively.
The next comparable disclosure will show whether the widening gap between earnings and revenue growth continues. The unresolved points in the presentation are the component-wise operating-expense drivers behind EBITDA growth and the FY26 increase in non-current liabilities to Rs 8.3878 crore from Rs 1.5006 crore, alongside debt to equity rising to 0.21 times from 0.16 times.