










TANFAC records ₹230.5 crore revenue as EBITDA margin falls
Key highlights
- TANFAC reported Q2 FY27 revenue from operations of ₹230.5 crore, up 36.6% year on year.
- TANFAC’s Q2 FY27 EBITDA margin was 13.3%, down from 16.2% in Q2 FY26.
- TANFAC’s H1 FY27 revenue reached ₹417.7 crore, while PAT was ₹35.9 crore versus ₹36.5 crore a year earlier.
- TANFAC raised ₹350 crore in June and September 2026, and its HFC-32 project is expected to be commissioned in Q3 FY27.
powered by IRIS
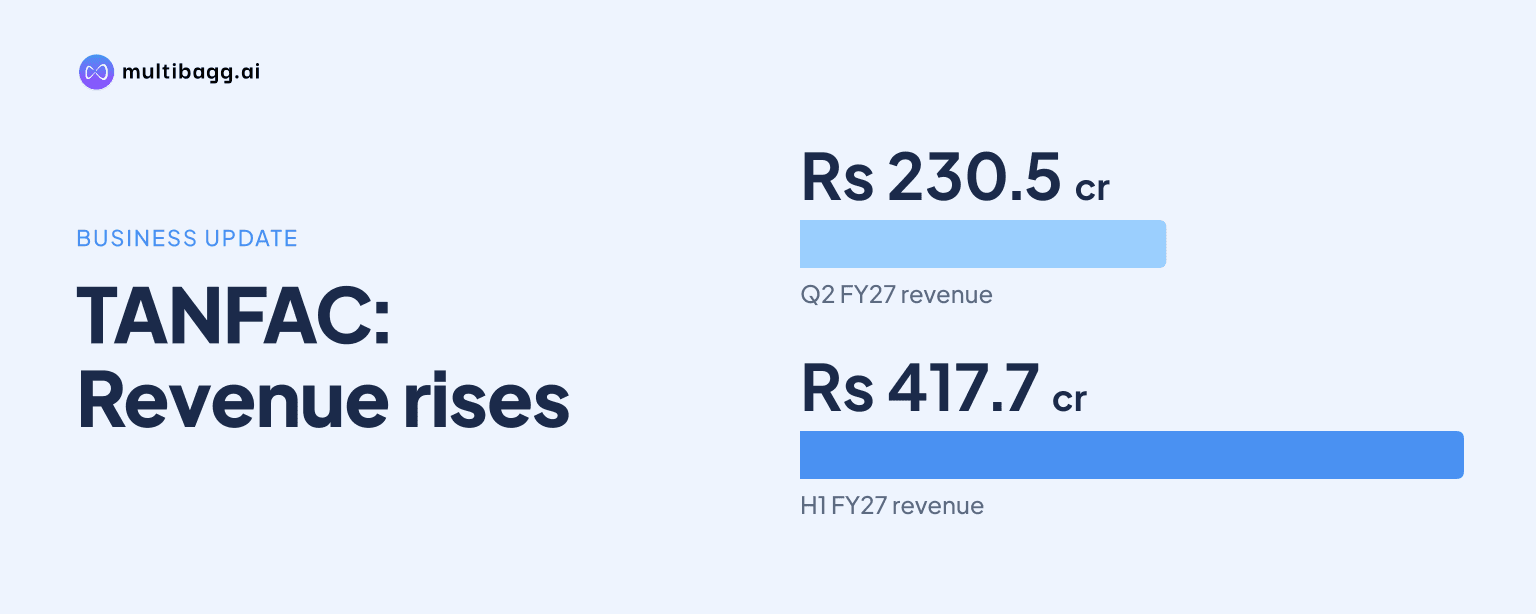
TANFAC Industries Limited recorded revenue from operations of ₹230.5 crore in Q2 FY27, its highest quarterly level, up 36.6% year on year, while EBITDA margin fell to 13.3% from 16.2%. TANFAC attributed sales growth mainly to higher realizations and cited input, power, fuel and freight costs as margin pressures.
Know Tanfac Industries inside out
Results, valuation, peers and who's buying, in one view.
How did TANFAC perform in Q2 FY27?
TANFAC reported record revenue from operations of ₹230.5 crore in Q2 FY27, compared with ₹187.2 crore in Q1 FY27 and ₹168.7 crore in Q2 FY26. That represented a ₹43.3 crore sequential increase and a ₹61.8 crore year-on-year increase. Total revenue, including other income, was ₹234.3 crore, while other income rose to ₹3.8 crore from ₹0.6 crore a year earlier.
The increase in sales did not produce a matching margin outcome. Earnings before interest, tax, depreciation and amortisation (EBITDA) reached ₹31.1 crore, above ₹29.5 crore in Q1 FY27 and ₹27.5 crore in Q2 FY26, but the EBITDA margin declined in both comparisons. Profit after tax (PAT) was ₹19.0 crore, versus ₹16.8 crore sequentially and ₹17.2 crore a year earlier.
Why did TANFAC’s revenue rise while margins declined?
TANFAC said Q2 FY27 revenue growth of 36.6% year on year was mainly driven by realization growth, alongside the introduction of new value-added specialty products to its existing customer base. Management described the quarter as its highest-ever revenue quarter and said the product additions were intended to diversify offerings across the fluorochemicals value chain. Revenue growth therefore reflected pricing or realization changes as well as new-product activity, rather than a disclosed volume figure.
TANFAC’s gross margin fell to 32.5% in Q2 FY27 from 39.1% in Q2 FY26 and 36.8% in Q1 FY27, even as gross profit increased to ₹74.8 crore. Management said gross profit per tonne in its AHF business remained largely stable, while higher product realizations expanded the revenue denominator and reduced the reported gross-margin percentage. It also cited elevated sulphur prices and the initial ramp-up of newer products, whose gross margins had not reached optimal levels.
The cost structure showed the pressure more directly. Cost of goods sold increased to ₹155.7 crore in Q2 FY27 from ₹102.7 crore a year earlier, while power and fuel expense rose to ₹19.2 crore from ₹11.8 crore. Management also cited higher freight costs amid geopolitical disruptions in West Asia; other expenses were ₹20.3 crore, close to ₹20.4 crore in Q2 FY26 but above ₹16.6 crore in Q1 FY27.
How did TANFAC’s first-half earnings compare with last year?
TANFAC generated ₹417.7 crore of revenue from operations in H1 FY27, up from ₹344.7 crore in H1 FY26, while EBITDA increased to ₹60.6 crore from ₹57.4 crore. The 21.2% revenue increase exceeded the 5.6% rise in EBITDA, which was reflected in EBITDA margin declining to 14.4% from 16.6%. Total revenue was ₹422.4 crore, including ₹4.7 crore of other income.
TANFAC’s H1 FY27 PAT fell to ₹35.9 crore from ₹36.5 crore despite the revenue and EBITDA increases. Profit before tax was ₹48.1 crore, marginally above ₹47.3 crore, while tax rose to ₹12.2 crore from ₹10.8 crore. Depreciation and amortisation increased to ₹9.7 crore from ₹7.9 crore, and finance cost rose to ₹2.7 crore from ₹2.2 crore; earnings per share were ₹17.35 compared with ₹18.31.
The first-half comparison also shows that gross profit expanded more slowly than sales. Gross profit was ₹143.7 crore in H1 FY27 versus ₹133.1 crore in H1 FY26, whereas gross margin fell to 34.4% from 38.6%. Power and fuel expense increased to ₹35.9 crore from ₹24.6 crore, while employee cost was ₹15.2 crore compared with ₹14.8 crore.
Got a follow-up? Ask IRIS
What changed in TANFAC’s cost base and balance sheet?
TANFAC increased raw-material inventory toward the end of Q2 FY27 through bulk procurement, principally of fluorspar, to preserve supply continuity amid potential West Asia disruptions. Inventories were ₹147.3 crore at September 2026, compared with ₹92.8 crore at March 2026. The company said this inventory increase raised trade payables by the same amount, with trade payables reaching ₹75.9 crore from ₹25.1 crore.
TANFAC’s balance sheet expanded to ₹1,006.0 crore at September 2026 from ₹527.7 crore at March 2026. Total equity rose to ₹736.8 crore from ₹373.2 crore, and cash and cash equivalents increased to ₹99.1 crore from ₹21.1 crore. Capital work-in-progress rose to ₹153.0 crore from ₹28.5 crore, while non-current borrowings were ₹66.1 crore and current borrowings were ₹69.5 crore at September 2026.
What expansion funding and capacity plans does TANFAC disclose?
TANFAC raised ₹350 crore through a ₹250 crore qualified institutional placement in June 2026 and a ₹100 crore preferential allotment in September 2026. The company said its promoter, Anupam Rasayan India Ltd, contributed ₹60.9 crore within the preferential issue, with the balance coming from other co-investors. Management said the equity issues would strengthen the balance sheet and support its growth pipeline.
The principal disclosed use is the HFC-32 refrigerant gas project, which has 20,000 metric tonnes per annum capacity and expected commissioning in Q3 FY27. Total committed expenditure was ₹360 crore, of which ₹231 crore had been spent as of September 30, 2026. Separately, TANFAC increased solar-grade DHF manufacturing capacity to 25,000 metric tonnes per annum from 20,000 metric tonnes per annum through debottlenecking with nominal capital expenditure.
Management expects H2 FY27 to deliver a stronger performance than H1 FY27, citing potential raw-material price moderation, operating leverage and the scale-up of recently introduced products. This is management’s outlook rather than a financial target. Its statement followed signs of sulphur-price moderation, while the presentation did not quantify either the expected benefit or the timing of margin recovery.
Conclusion
TANFAC’s Q2 FY27 results combined record revenue of ₹230.5 crore with lower reported profitability ratios. Higher realizations and specialty-product introductions lifted sales, but gross margin, EBITDA margin and PAT margin were below both Q1 FY27 and Q2 FY26 levels as input costs, power and fuel, and freight pressure affected the cost base.
The next disclosed milestones are the expected Q3 FY27 commissioning of the 20,000 metric tonnes per annum HFC-32 project and management’s expectation of a stronger H2 FY27 than H1 FY27. Readers can watch whether sulphur-price moderation, new-product scale-up and the solar-grade DHF capacity increase translate into the improved operating leverage management anticipates.