










TFS Q2 PAT rose 50.5% as Rs 46.8 crore write-back helped
Key highlights
- TFS reported Q2FY27 consolidated PAT of Rs 147.3 crore, up 50.5% year on year.
- A Rs 46.8 crore net-of-tax provision write-back was included in TFS’s Q2FY27 PAT.
- TFS’s Q2FY27 consolidated sales rose 19.5% to Rs 425.3 crore despite a 4.8% fall in passenger traffic.
- TFS reported nil consolidated debt and Rs 1,030.9 crore of consolidated cash at September 30, 2026.
powered by IRIS
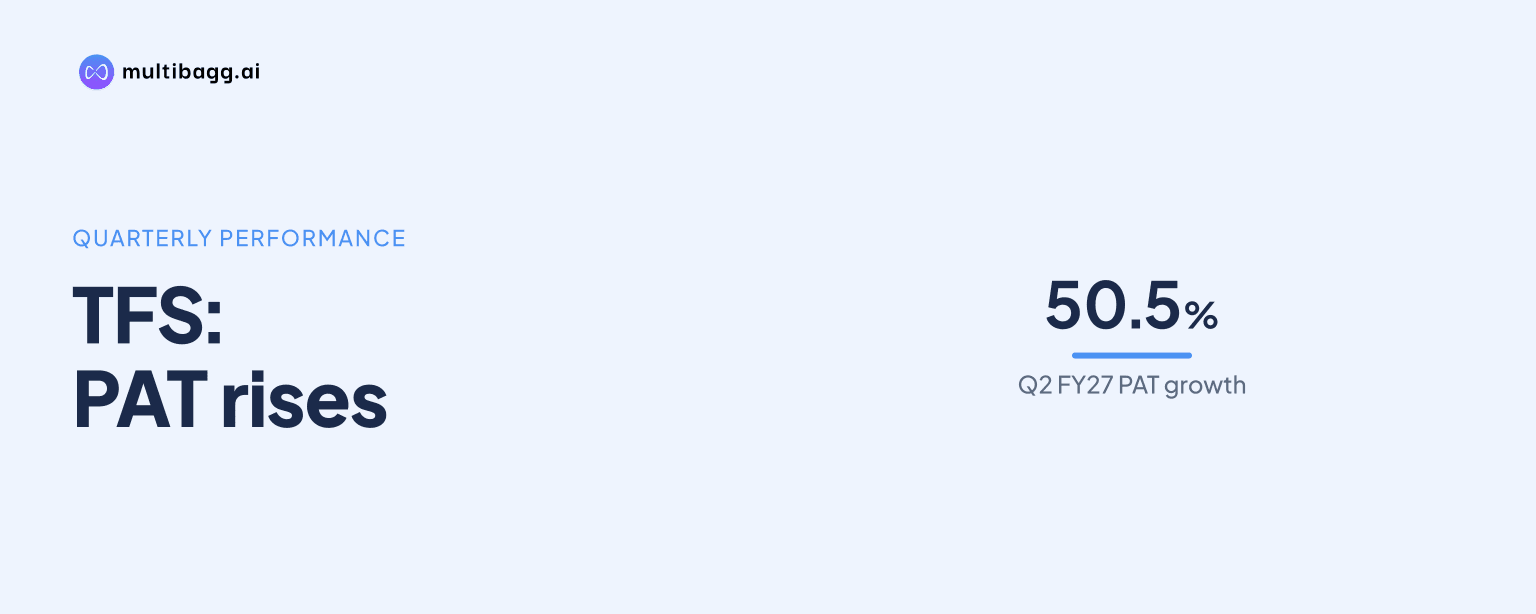
Travel Food Services Limited (TFS) reported Q2FY27 consolidated profit after tax (PAT) of Rs 147.3 crore, up 50.5% year on year, including a Rs 46.8 crore net-of-tax provision write-back. Consolidated sales rose 19.5% to Rs 425.3 crore, while earnings before interest, tax, depreciation and amortisation (EBITDA) increased 16.8% to Rs 157.9 crore.
Know Travel Food Services inside out
Results, valuation, peers and who's buying, in one view.
How much did TFS’s Q2FY27 profit increase?
TFS’s Q2FY27 consolidated PAT increased by Rs 49.4 crore from Rs 97.9 crore in Q2FY26 to Rs 147.3 crore, a 50.5% rise. Its PAT margin, which measures PAT as a share of consolidated sales, increased by 714 basis points to 34.6% from 27.5% in the prior-year quarter.
The reported result included a Rs 46.8 crore provision write-back, net of tax, during Q2FY27. That disclosed reversal was equivalent to about 94.7% of the Rs 49.4 crore year-on-year increase in reported PAT, explaining why the reported profit growth rate was above the 19.5% increase in consolidated sales.
A simple subtraction of the disclosed write-back from Q2FY27 PAT produces Rs 100.5 crore, compared with reported PAT of Rs 97.9 crore a year earlier. This is only an illustrative calculation, not a company-reported adjusted profit measure, because TFS also attributed PAT growth to sales growth and higher other income.
What drove TFS’s sales growth despite lower passenger traffic?
TFS grew Q2FY27 system-wide sales 18.8% to Rs 865.4 crore and consolidated sales 19.5% to Rs 425.3 crore, even as passenger traffic at TFS-managed airports declined 4.8% year on year. TFS attributed the traffic decline to geopolitical uncertainties, higher airfares and airline capacity rationalisation, with domestic passenger traffic more affected than international traffic.
On a system-wide basis, like-for-like sales growth was 3.5% and net contract gains contributed 11.1% in Q2FY27. TFS said new-unit mobilisation across airports supported contract gains, while revenue optimisation partly offset the softer passenger-traffic backdrop.
For consolidated sales, like-for-like growth was 6.6%, supported by menu innovation and calibrated premiumisation strategies, while net contract gains were 11.0%. TFS also cited new airport units and contribution from its lounge aggregation business, which records the related revenue within sales.
TFS reported a Q2FY27 gross profit margin of 85.8%, versus 83.9% in Q2FY26, but said the figure reflects accounting classification in lounge aggregation. It recorded Rs 21.6 crore of service costs in other expenses while recognising corresponding revenue as sales; excluding that effect, the Q2FY27 gross profit margin was 80.7%.
Did operating profitability keep pace with sales growth?
TFS’s operating profitability did not rise as quickly as sales in Q2FY27: EBITDA increased 16.8% to Rs 157.9 crore, below the 19.5% sales growth, and the EBITDA margin declined to 37.1% from 38.0%. TFS said mobilisation and ramp-up of new operations raised employee and other operating expenses during the quarter.
TFS expects revenue from the newly mobilised operations to build progressively in coming periods, while the associated ramp-up costs were already reflected in Q2FY27. This timing difference is relevant to the 86-basis-point year-on-year reduction in EBITDA margin, despite gross profit increasing 22.1% to Rs 364.9 crore.
The distinction between EBITDA and PAT is important in this quarter because TFS excludes other income from EBITDA and EBITDA margin, while it said PAT benefited from higher other income as well as the Rs 46.8 crore net-of-tax provision write-back. The 34.6% PAT margin therefore combines operating performance with these below-EBITDA items.
Got a follow-up? Ask IRIS
What does the first half indicate about TFS’s earnings quality?
TFS reported H1FY27 PAT of Rs 276.1 crore, up 43.2% from Rs 192.9 crore in H1FY26, while system-wide sales increased 18.4% to Rs 1,709 crore. Management attributed first-half PAT growth to sales growth, higher other income and an increased share of profit from joint ventures, in addition to provision reversals.
The disclosed H1FY27 provision write-backs totalled about Rs 56.6 crore net of tax, comprising the Rs 46.8 crore Q2 reversal and a goods and services tax provision write-back of about Rs 9.8 crore in Q1FY27. A simple deduction of these reversals gives an illustrative Rs 219.5 crore, or Rs 26.6 crore above H1FY26 reported PAT; it is not a management-adjusted earnings measure.
Passenger traffic at TFS-managed airports declined 2.2% year on year in H1FY27, after first-quarter traffic was in line with the prior year and Q2 was affected by airfares and route rationalisation. Against that backdrop, system-wide sales were supported by 13.5% net contract gains and 2.2% like-for-like sales growth.
TFS reported nil consolidated debt and consolidated cash of Rs 1,030.9 crore as of September 30, 2026. Its cash balance includes cash and cash equivalents, other bank balances and current investments, while diluted earnings per share for Q2FY27 was Rs 11.08, up 52.7% year on year.
What is TFS expecting in the second half of FY27?
TFS expects easing geopolitical pressures and seasonally stronger travel demand to create a more favourable passenger-traffic backdrop in the second half of FY27. This expectation follows the 4.8% system-wide passenger-traffic decline in Q2FY27 and is presented by management as an outlook, not as a forecasted sales or profit target.
Management said it is monitoring near-term passenger and consumption trends while maintaining cost discipline and pursuing growth opportunities. The operational build-out was visible in 535 Travel QSR outlets at September 2026, compared with 464 a year earlier, while its brand portfolio expanded to 156 from 135 over the same period.
Conclusion
TFS delivered a Q2FY27 PAT increase of 50.5% to Rs 147.3 crore, but the Rs 46.8 crore provision write-back is central to interpreting the reported acceleration over the 19.5% rise in consolidated sales. Operating measures showed continued sales expansion despite a 4.8% fall in airport passenger traffic, alongside an EBITDA-margin decline to 37.1% as new operations ramped up.
The next issue to watch is whether seasonally stronger second-half travel demand and revenue from newly mobilised units offset the ramp-up costs identified in Q2FY27. Management’s disclosed expectation of a better second-half traffic backdrop, together with the network increase to 535 Travel QSR outlets at September 2026, provides the stated context for that assessment.