










Thomas Scott inventory reaches Rs 114.9 crore in H1 FY27
Key highlights
- Thomas Scott's inventory increased to Rs 114.9 crore in H1 FY27 from Rs 85.8 crore at FY26.
- Thomas Scott's debt-to-equity ratio was unchanged at 0.34 times in H1 FY27.
- Thomas Scott's total borrowings increased to Rs 52.5 crore in H1 FY27 from Rs 46.5 crore at FY26.
- Thomas Scott's H1 FY27 revenue rose 30.6% year on year to Rs 144.7 crore.
powered by IRIS
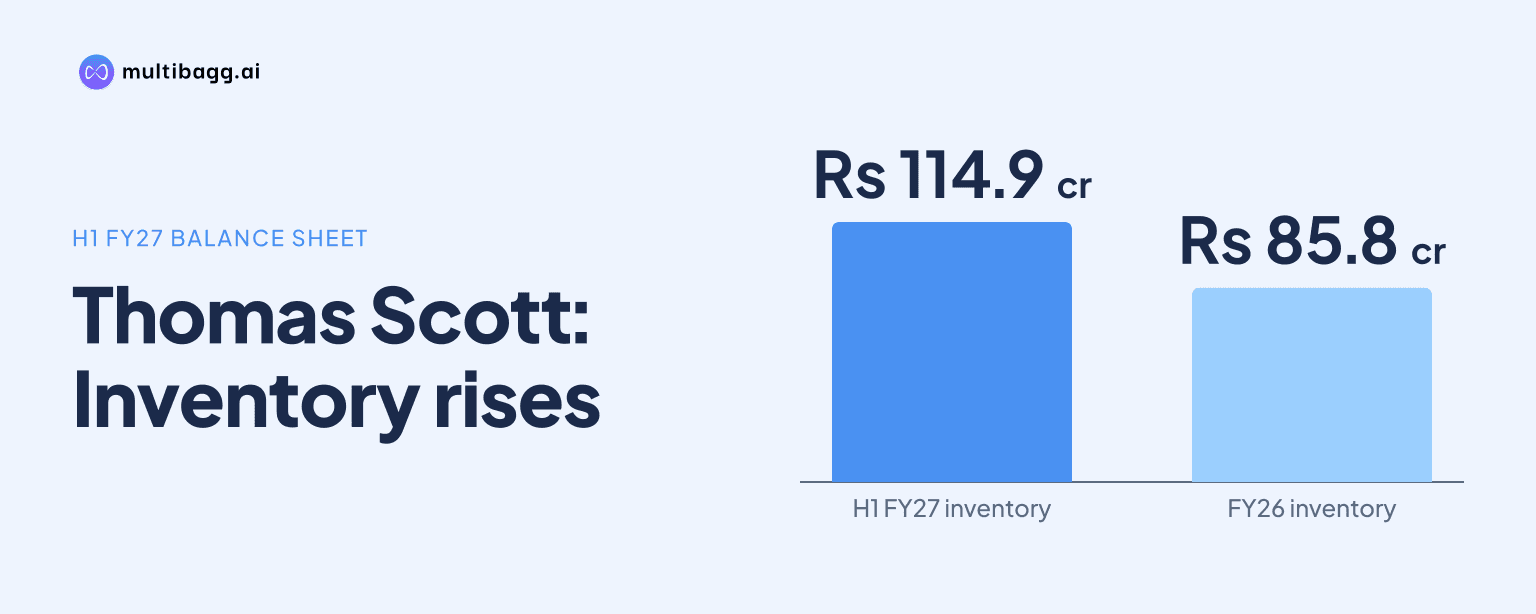
Thomas Scott (India) Limited reported inventory of Rs 114.9 crore in H1 FY27, Rs 29.1 crore above FY26, while debt-to-equity remained at 0.34 times. The inventory increase came as H1 FY27 revenue rose 30.6% year on year to Rs 144.7 crore and profit after tax increased 42.7% to Rs 11.7 crore.
Know Thomas Scott India inside out
Results, valuation, peers and who's buying, in one view.
Why did Thomas Scott's inventory reach Rs 114.9 crore?
Thomas Scott's inventory increased to Rs 114.9 crore in H1 FY27 from Rs 85.8 crore at FY26 and Rs 59.9 crore at FY25. The Rs 29.1 crore increase from FY26 made inventory the largest named current-asset category at H1 FY27, ahead of trade receivables of Rs 74 crore and other current assets of Rs 47.4 crore.
The presentation does not provide an inventory category split or identify an operational reason for the increase. Total current assets rose by Rs 19.3 crore to Rs 238.1 crore from Rs 218.8 crore at FY26, but receivables fell by Rs 12.2 crore over the same period. This meant the composition of current assets shifted toward inventory during H1 FY27.
How did Thomas Scott's borrowings and debt-to-equity change?
Thomas Scott reported total borrowings of Rs 52.5 crore in H1 FY27, comprising Rs 44.3 crore of current borrowings and Rs 8.2 crore of non-current borrowings. Total borrowings were Rs 46.5 crore at FY26, so they increased by Rs 6 crore in the half year. Current borrowings declined by Rs 0.7 crore, while non-current borrowings increased by Rs 6.7 crore.
Debt-to-equity was 0.34 times in H1 FY27, unchanged from FY26 in Thomas Scott's historical financial trend. Total equity nevertheless rose by Rs 16.3 crore to Rs 153.6 crore, consisting of Rs 14.9 crore in equity share capital and Rs 138.7 crore in other equity. The ratio was 0.12 times in FY24 and 0.13 times in FY25 before reaching 0.34 times in FY26.
What happened to Thomas Scott's receivables, payables and cash?
Thomas Scott's trade receivables declined to Rs 74 crore in H1 FY27 from Rs 86.2 crore at FY26, even as inventories increased by Rs 29.1 crore. Trade payables also fell, to Rs 43.2 crore from Rs 44.8 crore. The changes show that trading working-capital accounts did not all rise alongside the inventory balance.
Cash and cash equivalents increased from Rs 10 lakh at FY26 to Rs 1.6 crore in H1 FY27, while other current assets rose from Rs 46.5 crore to Rs 47.4 crore. Total current liabilities increased by Rs 1 crore to Rs 99.2 crore, including provisions of Rs 11.1 crore, compared with Rs 8.1 crore at FY26. Current assets exceeded current liabilities by Rs 138.9 crore at H1 FY27, based on reported balances of Rs 238.1 crore and Rs 99.2 crore.
Got a follow-up? Ask IRIS
How did Thomas Scott's earnings compare with the balance-sheet movement?
Thomas Scott generated revenue from operations of Rs 144.7 crore in H1 FY27, compared with Rs 110.8 crore in H1 FY26, a reported increase of 30.6%. Earnings before interest, tax, depreciation and amortisation, or EBITDA, rose 31% to Rs 19 crore, while the EBITDA margin increased by 4 basis points to 13.13%. The presentation does not establish a direct causal link between the higher inventory balance and revenue growth.
Profit after tax rose to Rs 11.7 crore from Rs 8.2 crore in H1 FY26, and the profit-after-tax margin rose by 69 basis points to 8.09%. Finance cost increased to Rs 2.3 crore from Rs 9 lakh in H1 FY26. In the revenue mix, business-to-consumer licensed brands generated Rs 87 crore in H1 FY27, compared with Rs 52.1 crore for own brands and Rs 5.6 crore for business-to-business operations.
What do Thomas Scott's historical working-capital and return measures show?
Thomas Scott reported 173 working-capital days in FY26, down from 211 days in FY25 and equal to the FY24 level of 173 days. The reduction between FY25 and FY26 coincided with revenue from operations increasing from Rs 161 crore to Rs 254.9 crore. The presentation does not report working-capital days for H1 FY27, so it does not show how the Rs 114.9 crore inventory balance affected that measure.
Return on equity, or ROE, was 14.06% in FY26, compared with 12.08% in FY25 and 19.72% in FY24. Return on capital employed, or ROCE, was 22.31% in FY26, compared with 16.47% in FY25 and 22.61% in FY24. Thomas Scott does not disclose H1 FY27 ROE or ROCE, although it reported H1 FY27 EBITDA of Rs 19 crore and profit after tax of Rs 11.7 crore.
Conclusion
Thomas Scott's H1 FY27 balance sheet records a Rs 29.1 crore increase in inventory to Rs 114.9 crore, alongside debt-to-equity unchanged at 0.34 times. Borrowings increased by Rs 6 crore from FY26 to Rs 52.5 crore, while receivables declined by Rs 12.2 crore. Revenue and profit after tax grew 30.6% and 42.7%, respectively, during the same half-year period.
The next disclosures to watch are inventory, receivables and borrowings relative to revenue, as Thomas Scott has not stated an inventory target, cash-conversion target or reason for the H1 FY27 inventory increase. The presentation reports working-capital days only through FY26, at 173 days, and does not provide H1 FY27 return on equity or return on capital employed.