










TI net debt rises to Rs 2,074 crore despite lower borrowings
Key highlights
- TI's net debt rose Rs 163 crore to Rs 2,074 crore at September 2026 from Rs 1,911 crore at March 2026.
- TI's gross debt fell Rs 93 crore to Rs 2,202 crore, while cash-related resources used in its net-debt calculation declined Rs 256 crore to Rs 128 crore.
- A Rs 302 crore working-capital outflow left TI with negative Rs 4 crore of operating cash flow in H1 FY27.
- TI's finance cost increased to Rs 136 crore in H1 FY27 from Rs 5 crore a year earlier, while reported profit after tax fell 61.9% to Rs 54 crore.
powered by IRIS
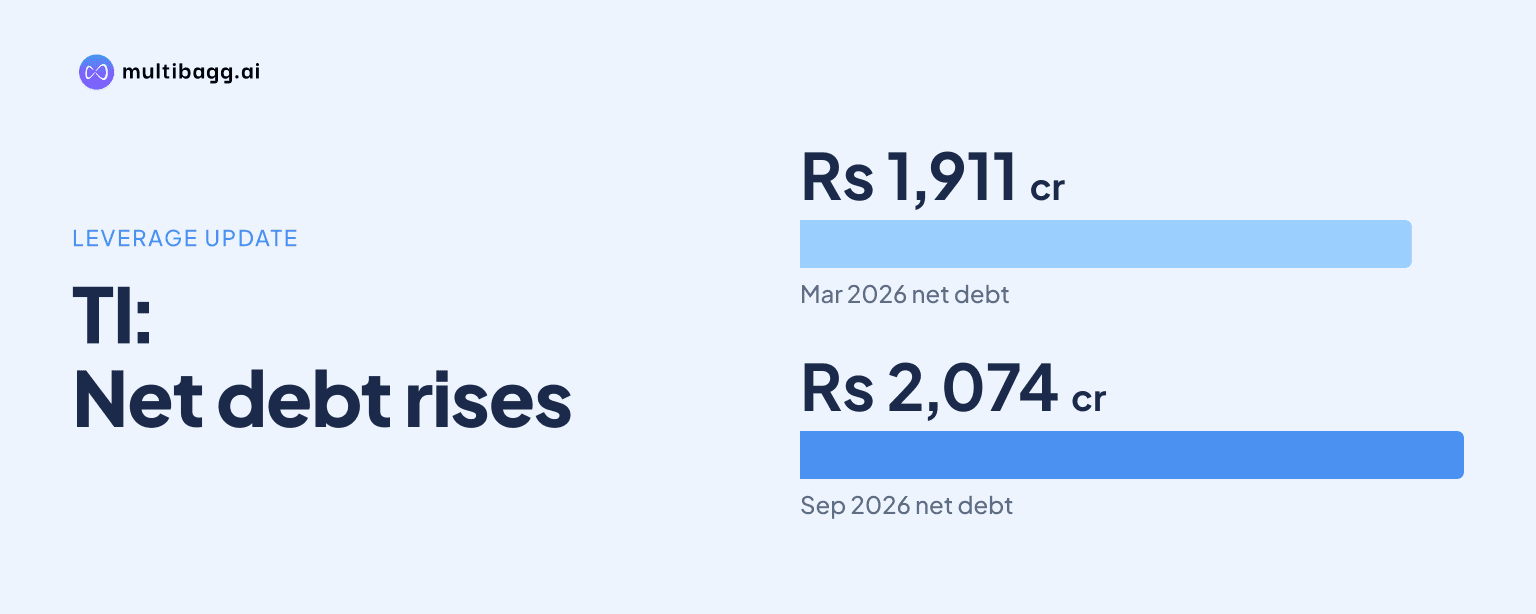
Tilaknagar Industries Ltd. reported net debt of Rs 2,074 crore at September 2026, Rs 163 crore above March 2026, although gross debt declined Rs 93 crore to Rs 2,202 crore. The presentation attributes the increase to investment across the complete working-capital cycle: a Rs 302 crore outflow in H1 FY27 left operating cash flow at negative Rs 4 crore.
Know Tilaknagar Industries inside out
Results, valuation, peers and who's buying, in one view.
Why did TI's net debt rise in September 2026?
TI's net debt rose because the decline in cash-related resources was larger than the reduction in gross borrowings. Gross debt fell to Rs 2,202 crore at September 2026 from Rs 2,295 crore at March 2026, while the cash measure used in the debt presentation declined to Rs 128 crore from Rs 384 crore. Net debt therefore increased to Rs 2,074 crore from Rs 1,911 crore.
TI said the March-to-September increase reflected investment across the complete working-capital cycle. Net debt did fall by Rs 26 crore from Rs 2,100 crore at June 2026, as gross debt declined Rs 39 crore during the quarter, but it remained Rs 163 crore above the March 2026 position.
The Rs 128 crore cash-related figure in TI's debt presentation differs from the Rs 72 crore of cash and cash equivalents on its September 2026 balance sheet. For net-debt purposes, TI also includes bank balances, short-term bank deposits, term bank deposits, earmarked deposits and investments in liquid securities.
How did TI's borrowing mix change from March to September 2026?
TI reduced working-capital loans by Rs 95 crore between March and September 2026, while term loans were broadly unchanged. Working-capital loans declined to Rs 135 crore from Rs 230 crore, term loans increased Rs 3 crore to Rs 2,043 crore, and other borrowings declined Rs 1 crore to Rs 24 crore.
The balance sheet records the same Rs 93 crore reduction in total borrowings. Current borrowings fell to Rs 167 crore at September 2026 from Rs 267 crore at March 2026, while non-current borrowings increased to Rs 2,035 crore from Rs 2,028 crore. Together, these balances totalled Rs 2,202 crore at September 2026.
TI's term loan has a six-year term, with a two-year principal moratorium at the start. After the moratorium, 65% of the principal is scheduled for repayment in the sixth year; TI puts the effective interest rate at about 10% to 11%. The September 2026 lender group listed ICICI Bank, Kotak, J.P. Morgan, Piramal Finance, Poonawalla Fincorp and Avendus.
What caused TI's operating cash flow to turn negative?
A Rs 302 crore working-capital movement absorbed TI's Rs 299 crore operating profit before working-capital changes in H1 FY27. After Rs 2 crore of direct taxes, net cash from operating activities was negative Rs 4 crore for the half year ended September 2026, compared with positive Rs 70 crore in the half year ended September 2025.
The working-capital outflow was Rs 215 crore higher than the Rs 87 crore movement in the prior-year half. Since March 2026, inventories increased Rs 129 crore to Rs 531 crore and trade receivables rose Rs 283 crore to Rs 1,555 crore. Trade payables also increased, including dues to micro and small enterprises, which rose to Rs 91 crore from Rs 42 crore.
Investing activities generated Rs 81 crore in H1 FY27, compared with an outflow of Rs 243 crore a year earlier. Financing activities used Rs 222 crore, versus generating Rs 987 crore in H1 FY26. These flows reduced balance-sheet cash and cash equivalents by Rs 146 crore, from Rs 218 crore at the period's opening to Rs 72 crore at September 2026.
Got a follow-up? Ask IRIS
How did TI's finance costs and earnings change in H1 FY27?
TI's finance cost increased to Rs 136 crore in H1 FY27 from Rs 5 crore in H1 FY26, while reported profit before tax declined to Rs 54 crore from Rs 142 crore. This occurred as revenue from operations rose 169.1% year on year to Rs 2,081 crore and earnings before interest, tax, depreciation and amortisation, or EBITDA, increased 104.9% to Rs 317 crore.
Depreciation and amortisation increased to Rs 92 crore from Rs 15 crore, and exceptional items were Rs 41 crore in H1 FY27 against nil in H1 FY26. Reported profit after tax consequently declined 61.9% to Rs 54 crore, despite EBITDA increasing Rs 162 crore over the prior-year half.
In Q2 FY27, TI reported net revenue of Rs 1,035 crore and EBITDA of Rs 148 crore, including subsidy income, with an EBITDA margin of 14.3%. That was 157 basis points below Q2 FY26 and 186 basis points below Q1 FY27. TI attributed the quarterly gross-margin movement partly to lower net sales realisation from state mix and inflation in packaging materials and extra neutral alcohol, partly offset by supply-chain efficiencies.
What is TI's net-debt target for March 2027?
TI's stated target is for March 2027 net debt to be below the Rs 1,911 crore reported at March 2026. From September 2026 net debt of Rs 2,074 crore, this implies a reduction of more than Rs 163 crore over the following six months; the presentation does not state a specific repayment amount or annual cash-flow target.
TI's plan includes completing the transition services and manufacturing agreement, or TSMA, in its one remaining state by no later than the Q4 FY27 exit. More than 90% of Imperial Blue volumes were under TI operations, while average monthly TSMA expenses were about Rs 2.6 crore in Q2 FY27. TI also identifies packaging, customs, bottling charges and general, information technology and administrative costs as integration savings areas within 24 months.
Conclusion
TI's September 2026 net-debt position shows that lower gross borrowing did not translate into lower net debt because cash-related resources declined more sharply. The Rs 93 crore fall in gross debt was outweighed by a Rs 256 crore reduction in the cash measure used for the debt calculation, following a Rs 302 crore working-capital outflow and negative Rs 4 crore operating cash flow in H1 FY27.
The next disclosed milestone is TI's target to bring March 2027 net debt below the Rs 1,911 crore March 2026 level. Working-capital movements in inventory and receivables, the planned Q4 FY27 TSMA exit, and execution of the stated integration savings measures will be relevant to that target.