










Tilaknagar Industries revenue rises 173%, reported PAT falls 58%
Key highlights
- Tilaknagar Industries' Q2 FY27 net revenue including subsidy rose 173% year on year to Rs 1,035 crore.
- Q2 FY27 total volume reached 8.9 million cases, up 160% year on year, with Imperial Blue contributing 5.5 million cases.
- Q2 FY27 EBITDA increased 146% year on year to Rs 148 crore, but the EBITDA margin declined to 14.3% from 15.9%.
- Net debt stood at Rs 2,074 crore in September 2026, up from Rs 1,911 crore in March 2026, while operating cash flow for H1 FY27 was an outflow of Rs 4 crore.
powered by IRIS
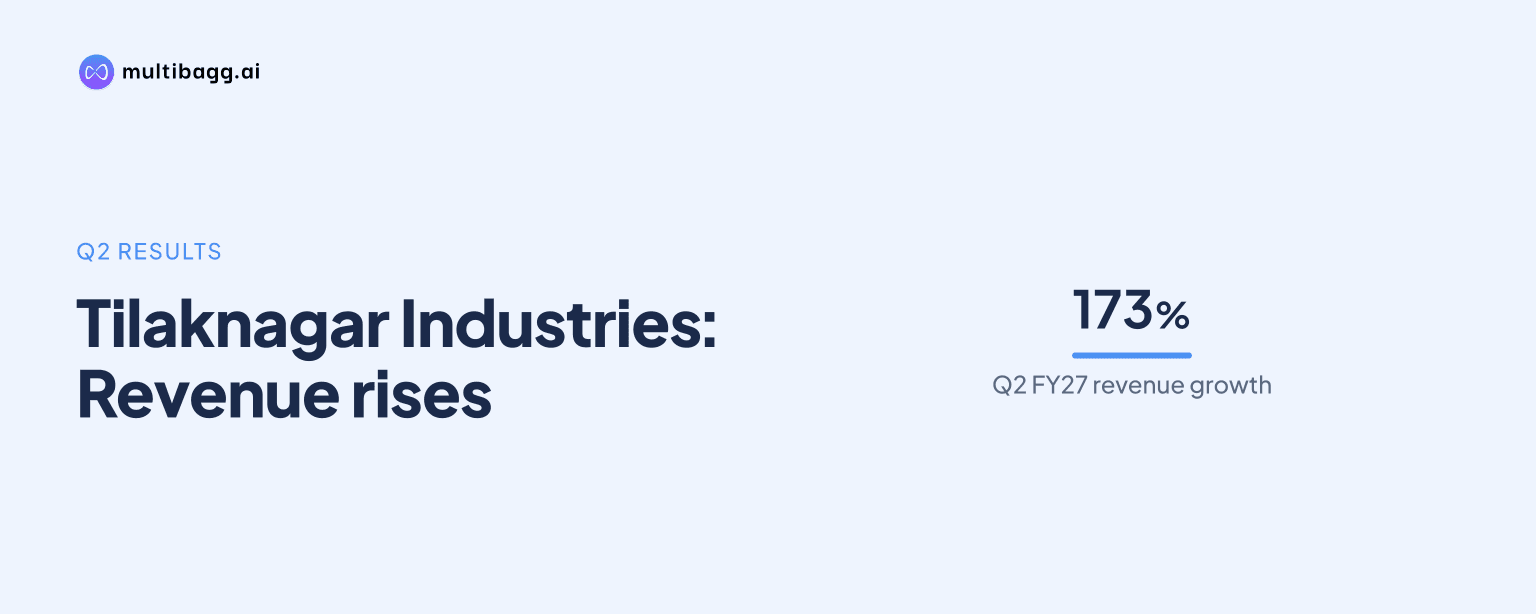
Tilaknagar Industries Ltd reported Q2 FY27 net revenue of Rs 1,035 crore, up 173% year on year, but reported profit after tax fell 58% to Rs 22 crore. The Imperial Blue acquisition expanded volumes, while Rs 69 crore of finance cost, Rs 46 crore of depreciation and amortisation, and Rs 11 crore of exceptional items reduced reported earnings.
Know Tilaknagar Industries inside out
Results, valuation, peers and who's buying, in one view.
Why did Tilaknagar Industries revenue rise 173% in Q2 FY27?
Tilaknagar Industries' revenue increase principally reflected the addition of Imperial Blue, acquired in November 2025. Net revenue including subsidy increased to Rs 1,035 crore in Q2 FY27 from Rs 380 crore in Q2 FY26, while gross revenue from operations rose to Rs 2,438 crore from Rs 897 crore. Excise duty increased 171% to Rs 1,402 crore, leaving net revenue 1% below the Rs 1,046 crore reported in Q1 FY27.
Total volume reached 8.9 million cases, up 160% year on year and 2% quarter on quarter. Imperial Blue contributed 5.5 million cases and increased 1.5% sequentially, while the existing business, termed Ex-IB, sold 3.4 million cases, down 0.5% year on year but up 2% sequentially. For H1 FY27, net revenue including subsidy rose 169% to Rs 2,081 crore from Rs 773 crore; year-on-year Imperial Blue volume comparison was unavailable because the acquisition closed in November 2025.
How did Tilaknagar Industries' margins change in Q2 FY27?
Tilaknagar Industries' reported EBITDA margin fell as costs and the sales mix offset the revenue expansion. Earnings before interest, tax, depreciation and amortisation, or EBITDA, rose 146% year on year to Rs 148 crore, but the margin declined 157 basis points to 14.3% from 15.9%. EBITDA was also 12.4% below Rs 169 crore in Q1 FY27, when the margin was 16.1%.
On the subsidy-adjusted presentation, gross profit was Rs 432 crore and gross margin was 41.8%, compared with a 42.1% margin in Q1 FY27. Management attributed the 32-basis-point sequential reduction to lower net sales realisation, or NSR, from state mix and inflation in glass packaging and extra neutral alcohol, or ENA. It said supply-chain efficiencies partly offset the pressure and that gross margin would have exceeded 44% excluding inflation.
NSR was Rs 1,174 per case, 3.2% above Rs 1,138 in Q2 FY26 but 0.8% below Rs 1,183 in Q1 FY27. Management said primary volumes were broadly flat sequentially, whereas secondary volumes increased 8% quarter on quarter. Imperial Blue secondary volumes grew 8.5% and Ex-IB secondary volumes grew 6.7%, while Imperial Blue gained more than 100 basis points of pan-India market share during the quarter.
Why did Tilaknagar Industries' reported PAT decline despite higher revenue?
Tilaknagar Industries' reported profit after tax, or PAT, declined because depreciation and amortisation, finance cost and exceptional charges increased substantially after the acquisition. Reported PAT was Rs 22 crore in Q2 FY27, down 57.7% from Rs 53 crore a year earlier and down 29.5% from Rs 32 crore in Q1 FY27. Profit before tax similarly declined 57.9% year on year to Rs 22 crore.
Depreciation and amortisation rose to Rs 46 crore from Rs 7 crore in Q2 FY26, and the subsidy-adjusted profitability discussion included Rs 35 crore of acquisition-related intangible-asset amortisation. Finance cost increased to Rs 69 crore from Rs 2 crore a year earlier, following EBITDA of Rs 148 crore and reducing earnings before interest and tax to Rs 102 crore. Exceptional items totalled Rs 11 crore, comprising Rs 8 crore of Transition Services and Manufacturing Agreement, or TSMA, costs and Rs 3 crore of transaction and integration costs.
PAT excluding exceptional items was Rs 33 crore, down 37% from Rs 53 crore in Q2 FY26. The presentation also reported a separate subsidy-adjusted profitability measure of Rs 66 crore, which excludes Rs 11 crore of exceptional items and Rs 35 crore of acquisition-related amortisation. That adjusted measure is not the same as the Rs 22 crore reported PAT in the income statement.
Got a follow-up? Ask IRIS
What is Tilaknagar Industries' Imperial Blue integration plan?
Tilaknagar Industries said states moved out of the TSMA after Q1 FY27 had stabilised under its operations, reducing exceptional transition costs significantly in Q2 FY27. The last remaining state is scheduled to transition toward the end of FY27. Management expects exceptional costs to remain at Q2 FY27 levels for the next two quarters, indicating that the transition programme is not yet complete.
Management identified Karnataka, Andhra Pradesh, Uttarakhand, Assam and Rajasthan as contributors to Imperial Blue's market-share gains. It said Karnataka's excise-policy reforms supported growth in the prestige-and-above category. In the existing portfolio, Mansion House Reserve Brandy recorded more than 25% quarter-on-quarter volume growth and 50% year-on-year growth in September 2026, which management described as its highest-volume month.
Tilaknagar Industries plans to pursue profitable growth in Imperial Blue and Mansion House, while using Imperial Blue's distribution network to introduce products at premium price points. Management said it expects NSR growth from a favourable state mix, price increases and launches expected from FY28 onward. The plan also calls for accelerating the luxury and super-premium portfolio across key markets.
How did Tilaknagar Industries' debt and cash position change?
Tilaknagar Industries' gross debt declined to Rs 2,202 crore at September 2026 from Rs 2,295 crore at March 2026, while net debt rose to Rs 2,074 crore from Rs 1,911 crore. Net debt had been Rs 2,100 crore at June 2026. Management attributed the increase from March to investment across the working-capital cycle and set a target for March 2027 net debt below the March 2026 level.
Balance-sheet cash and cash equivalents were Rs 72 crore at September 2026, compared with Rs 218 crore at March 2026. The debt presentation used a broader cash measure of Rs 128 crore, including bank balances, deposits and liquid securities. For the half year ended September 2026, operating cash flow was an outflow of Rs 4 crore, versus an inflow of Rs 70 crore a year earlier, after Rs 302 crore of working-capital changes.
The term loan stood at Rs 2,043 crore at September 2026, compared with Rs 2,040 crore at March 2026. Tilaknagar Industries said the six-year facility has a two-year principal moratorium and an effective interest rate of about 10% to 11%. It also stated that 65% of principal repayment is due in the sixth year under the loan's balloon repayment structure.
Conclusion
Tilaknagar Industries' Q2 FY27 figures show that Imperial Blue materially enlarged the revenue base, taking net revenue to Rs 1,035 crore and quarterly volume to 8.9 million cases. However, reported PAT moved in the opposite direction, falling to Rs 22 crore as higher material costs, acquisition-related amortisation, finance cost and TSMA-related charges outweighed the operating increase.
The next disclosures to watch are the transition of the final TSMA state toward the end of FY27 and the exceptional costs that management expects to continue at Q2 FY27 levels for two further quarters. Management's March 2027 target of net debt below the March 2026 level, together with expected price increases, state-mix changes and FY28 launches, will also shape the next phase of the plan.