










TVS Electronics H1 loss widens as EBITDA margin reaches 0.5%
Key highlights
- TVS-E reported an Rs 8 crore PAT loss in H1-FY27, compared with an Rs 2 crore loss in H1-FY26.
- TVS-E's H1-FY27 EBITDA fell 82.0% year on year to Rs 1.1 crore and EBITDA margin declined to 0.50%.
- TVS-E's Q2-FY27 revenue rose 9.6% sequentially to Rs 116.2 crore after Q1-FY27 order-execution delays.
- TVS-E's current borrowings increased to Rs 51.3 crore at H1-FY27 from Rs 36.3 crore at FY26.
powered by IRIS
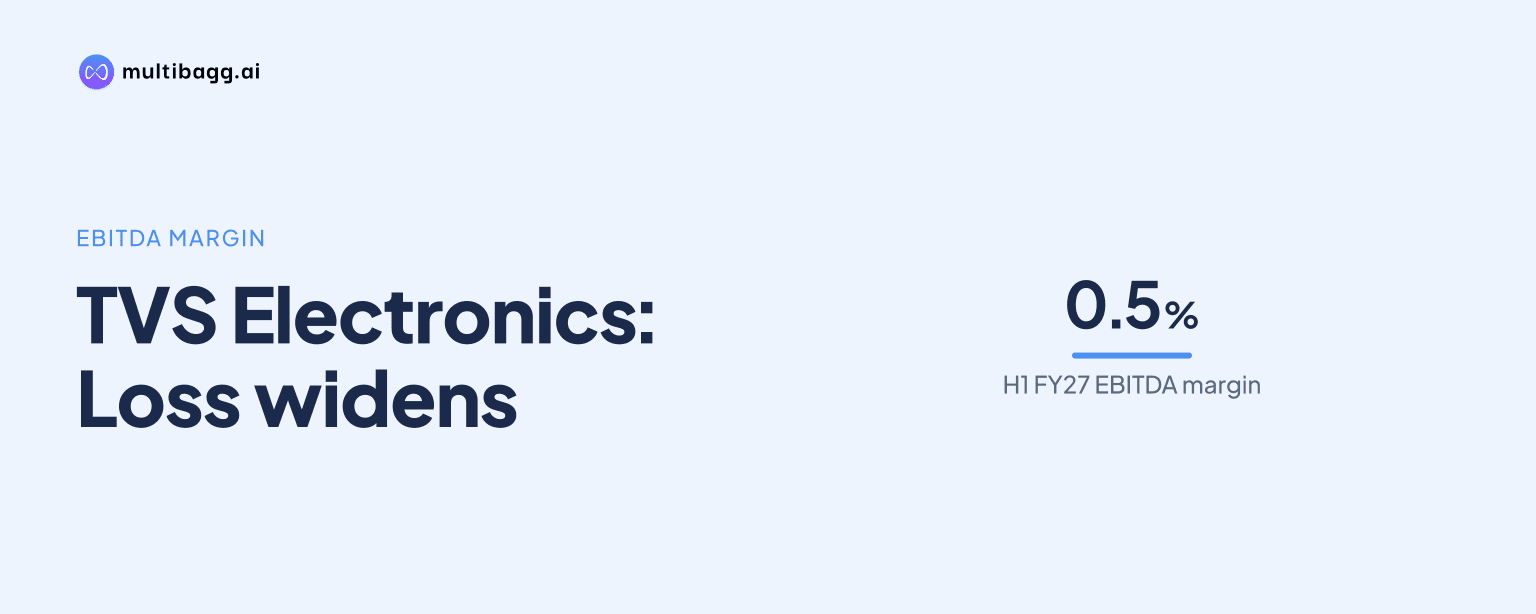
TVS Electronics reported an Rs 8 crore loss in H1-FY27 as earnings before interest, tax, depreciation and amortisation (EBITDA) fell 82.0% year on year to Rs 1.1 crore and its EBITDA margin contracted to 0.50% from 2.72%. Revenue from operations declined only 0.9% to Rs 222.2 crore, while expenses increased 1.4%.
Know TVS Electronics inside out
Results, valuation, peers and who's buying, in one view.
Why did TVS-E's H1-FY27 loss widen?
TVS-E's H1-FY27 loss widened because the Rs 5 crore fall in EBITDA, combined with lower other income, outweighed lower depreciation and finance costs. Profit after tax (PAT) was a loss of Rs 8 crore, compared with a Rs 2 crore loss in H1-FY26, and the PAT margin declined by 271 basis points to negative 3.60%.
The revenue change was limited relative to the movement in operating profit. Revenue from operations decreased by Rs 2 crore to Rs 222.2 crore, but total expenses increased by Rs 3 crore to Rs 221.1 crore. Consequently, EBITDA fell from Rs 6.1 crore in H1-FY26 to Rs 1.1 crore in H1-FY27.
TVS-E also recorded other income of Rs 90 lakh in H1-FY27, down 70.0% from Rs 3 crore a year earlier. Depreciation fell 4.7% to Rs 8.2 crore and finance cost declined 11.8% to Rs 3 crore, but those reductions did not offset the decline in EBITDA and other income.
How did TVS-E's divisions perform in Q2-FY27?
TVS-E's two operating divisions both grew sequentially in Q2-FY27, although Product & Solutions Group remained below its year-earlier revenue level. Product & Solutions Group revenue rose 9.5% quarter on quarter to Rs 79.4 crore, while Customer Support Services increased 9.9% to Rs 36.8 crore.
Product & Solutions Group revenue was nevertheless down 14.6% from Rs 93 crore in Q2-FY26. Customer Support Services rose 6.7% from Rs 34.5 crore in the prior-year quarter. For H1-FY27, Product & Solutions Group revenue declined 3.6% to Rs 151.9 crore, whereas Customer Support Services increased 5.4% to Rs 70.3 crore.
TVS-E attributed the 9.6% sequential rise in total Q2 revenue to recovery across both verticals after order-execution delays in Q1-FY27. The presentation said higher volumes supported Product & Solutions Group, while service volumes picked up across existing Customer Support Services accounts.
Got a follow-up? Ask IRIS
What drove TVS-E's margin contraction?
TVS-E said elevated material costs and continued investment in new business initiatives and capability building kept margins under pressure in H1-FY27. With expenses rising 1.4% while revenue fell 0.9%, the EBITDA margin contracted by 222 basis points to 0.50%.
The H1-FY27 margin was below the 4.28% reported for FY26, 2.56% for FY25 and 2.62% for FY24. EBITDA in H1-FY27 was Rs 1.1 crore, compared with Rs 19.5 crore in FY26, although the annual periods are not directly comparable with a half-year period.
The second quarter showed a sequential recovery but remained weaker year on year. Q2-FY27 EBITDA was Rs 3.4 crore, compared with a loss of Rs 2.4 crore in Q1-FY27, lifting the EBITDA margin by 519 basis points to 2.93%; it was still below the 3.76% margin and Rs 4.8 crore EBITDA recorded in Q2-FY26.
TVS-E's Q2 PAT loss narrowed to Rs 1.4 crore from a Rs 6.6 crore loss in Q1-FY27. Against Q2-FY26, however, the result shifted from a Rs 1.6 crore PAT profit to a loss, as other income fell to Rs 50 lakh from Rs 1.8 crore and EBITDA declined by 29.2%.
What do TVS-E's balance sheet and plans indicate?
TVS-E reported higher current borrowings and lower equity at H1-FY27 than at FY26. Current borrowings increased to Rs 51.3 crore from Rs 36.3 crore, total equity declined to Rs 88.3 crore from Rs 95.9 crore, and the reported debt-to-equity ratio rose to 0.73 times from 0.56 times.
Trade receivables declined to Rs 79.6 crore at H1-FY27 from Rs 95.1 crore at FY26, while inventories increased to Rs 73 crore from Rs 71.4 crore. Cash and cash equivalents fell to Rs 15 lakh from Rs 22 lakh, and total liabilities declined to Rs 182 crore from Rs 186.6 crore.
TVS-E said cost optimisation and operational efficiency remain priorities as it works towards sustainable growth and margin improvement. Its stated capability investments include new Surface Mount Technology lines at Tumakuru, covering supply-chain management, printed circuit board assembly, box build, aftersales services and product testing.
The presentation also shows that the top 10 customer concentration increased to 40% in FY26 from 36% in FY25 and 30% in FY24. This change occurred alongside FY26 operational revenue of Rs 455.2 crore, up from Rs 430.5 crore in FY25, before the H1-FY27 revenue decline to Rs 222.2 crore.
Conclusion
TVS-E's H1-FY27 result shows that a Rs 2 crore year-on-year reduction in revenue coincided with a Rs 5 crore decline in EBITDA, reducing the margin to 0.50% and widening the PAT loss to Rs 8 crore. Q2 brought sequential improvement in both divisions, EBITDA and PAT, but Product & Solutions Group revenue and overall quarterly margins remained below Q2-FY26 levels.
The next results will show whether TVS-E's cost-optimisation and operational-efficiency measures can extend the Q2 recovery while material costs and capability investments remain elevated. The presentation provides no quantified revenue or margin target, leaving progress in the Tumakuru manufacturing initiative, Customer Support Services growth and the recovery from Q1 order-execution delays as disclosed matters to watch.