










USD/INR Exchange Rate at 92.68 Tests Rupee Reversal Trend
Key highlights
- USD/INR closed at 92.68 on November 20, 4.3% below its July 22 peak of 96.88.
- USD/INR has remained below its 50-day average of 95.13 and 200-day average of 94.64 since November 5.
- The rupee gained more than 1.6% in five sessions, with USD/INR moving from 94.24 on November 13 to about 92.68.
- The 94.60-95.00 range is the key resistance zone, while 91.40 and 88.60 are the next reference levels.
powered by IRIS
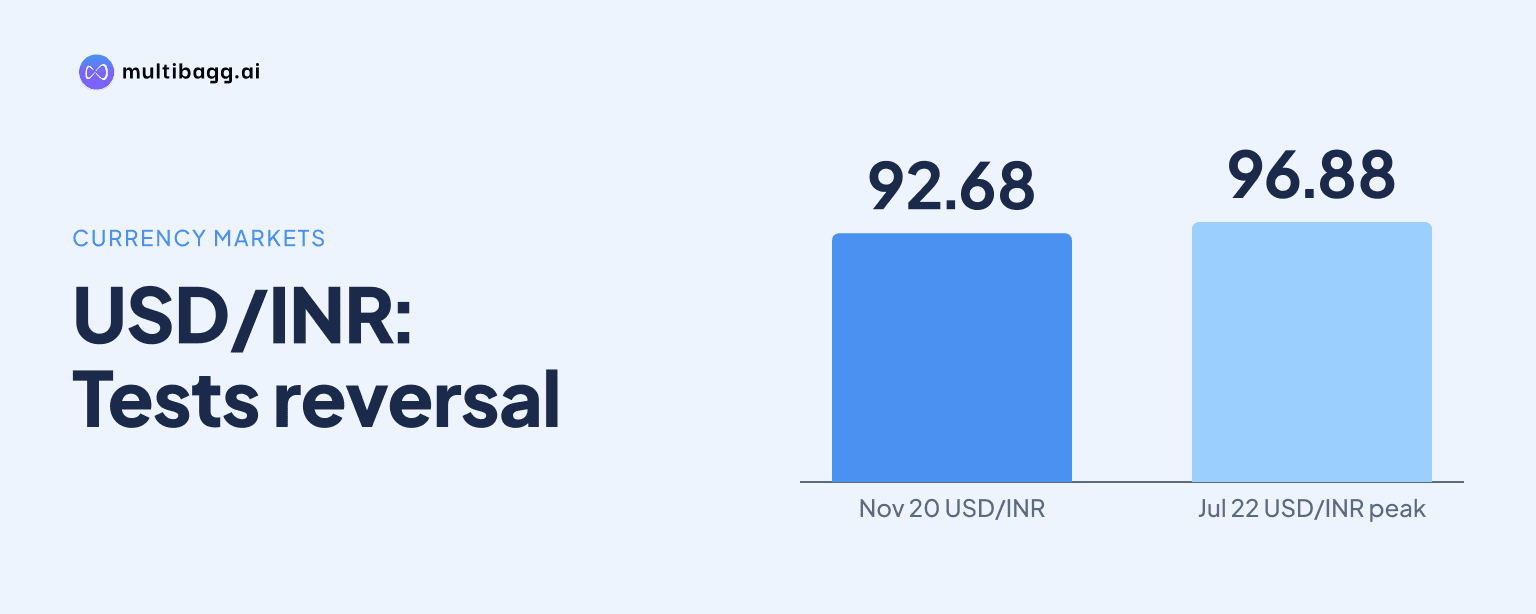
USD/INR exchange rate closed at 92.68 on November 20, 4.3% below its July 22 closing high of 96.88, putting a potential rupee reversal under test. The pair has remained below its 50-day and 200-day averages since November 5, but reported RBI reserve-building and importer dollar demand leave the longer-term direction unresolved.
Why has USD/INR fallen to 92.68?
USD/INR has fallen as reported foreign portfolio inflows, softer crude oil prices and exporter dollar sales increased support for the rupee. The pair rose steadily over the previous five years, moving from about 74 in late 2021 to a closing high of 96.88 on July 22, 2026. Its close at 92.68 on November 20 therefore represented a meaningful pullback from the July peak, rather than evidence on its own of a confirmed long-term reversal.
The immediate move has been sharp. USD/INR was reported at 94.24 on November 13 before moving to about 92.68 on November 20 and 21, a gain for the rupee of more than 1.6% over five sessions. Separately, the rupee was said to be up 2.46% in November through that point, from 94.96 at the end of October. It also reached a seven-month high at 92.68.
The reported context remains mixed. One discussion said foreign portfolio investment inflows could exceed $7.5 billion in November, while other commentary pointed to continued dollar strength globally. The rupee's recovery has occurred even as the US Dollar Index was described as touching a 20-month high, underlining that domestic flows and lower crude prices have been important to the recent move.
Which USD/INR levels matter for the reversal view?
The key USD/INR level for the reversal view is the 94.60-95.00 zone, because a closing move above 95.00 would invalidate that technical case. Since November 5, the pair has stayed below its 50-day moving average of 95.13 and its 200-day moving average of 94.64. Rebounds during November were reported to have stalled around 94.50-94.60.
The levels show why a reversal remains a developing scenario rather than a settled conclusion. A move toward 91.40 would extend the recent rupee strength, while a break below 88.60 would place the older 83.40 area in focus. However, the context says such a larger decline in USD/INR would require a more substantial shift in capital flows.
A separate market view identified 91.80-92.10 as strong support for USD/INR, with a sustained close above 93.50 signalling a reversal in the near-term trend. The differing thresholds highlight the likelihood of choppy trading around the current level rather than a straight move in either direction.
Got a follow-up? Ask IRIS
What is supporting the rupee's recent strength?
USD/INR has been supported by reported foreign portfolio inflows into domestic equities, lower crude oil prices and reduced spot-dollar demand. For India, softer crude prices can reduce import-related dollar demand, while foreign investment inflows add to dollar supply in the domestic market. Exporter dollar sales were also cited as a factor behind the November gain.
The improvement in the rupee coincided with softer government bond yields. The benchmark 10-year government bond yield was reported at 7.19%, compared with 7.25% at the previous close, while the five-year yield settled at 6.94% versus 7.01%. These moves were reported alongside improved domestic market sentiment, though they do not establish a permanent change in currency direction.
Near-term expectations in the discussion remain relatively narrow. Analysts cited a USD/INR range of 92.25-93.00, while another reported range was 92.40-93.00. Goldman Sachs was reported to expect about 94 in the next quarter, which points to uncertainty over whether the rupee can sustain its current gains.
What could interrupt the USD/INR decline?
USD/INR could rebound if crude oil rises, foreign capital inflows weaken or importer dollar demand increases. Public sector banks were reported to be buying dollars for oil importers, a factor that can support the pair during declines. Geopolitical tensions and a reversal in portfolio flows were also cited as risks to the rupee's recovery.
The Reserve Bank of India is another important variable. Its foreign exchange reserves were reported at about $717 billion, and reserve-building can involve dollar purchases that limit or interrupt rupee appreciation. The reported reserve position provides room for intervention, but it also means market moves may not follow technical levels in a smooth manner.
The recent rebound has reduced, rather than eliminated, the broader weakness seen over the longer period. One data feed still showed USD/INR up 4.77% over 12 months as of November 22, while another report put the preceding 12-month decline in the rupee at 3.45%. Those figures reinforce that the near-term recovery must persist before the five-year trend can be considered reversed.
Conclusion
USD/INR at 92.68 marks a notable improvement for the rupee from the 96.88 peak in July and levels above 94 earlier in November. Staying below the 50-day and 200-day averages supports the view that the prior dollar rally has lost momentum, but the technical setup has not yet confirmed a lasting reversal.
The next test is whether USD/INR rebounds but remains below 94.60-95.00, while foreign portfolio inflows continue and crude oil stays softer. A move toward 91.40 would extend the current trend, whereas renewed importer demand, RBI dollar purchases or weaker capital flows could return the pair toward the resistance levels under watch.