










VECV Q2 Profit Rises 37% While H1 EBITDA Margin Falls
Key highlights
- VECV Q2 FY27 PAT including OCI rose 37.0% to Rs 342 crore.
- VECV Q2 FY27 revenue from operations increased 24.0% to Rs 7,569 crore.
- VECV H1 FY27 EBITDA margin declined 50 basis points to 8.1%.
- VECV Q2 FY27 volume above 2.0 tonnes rose 28.2% to 28,071 units.
powered by IRIS
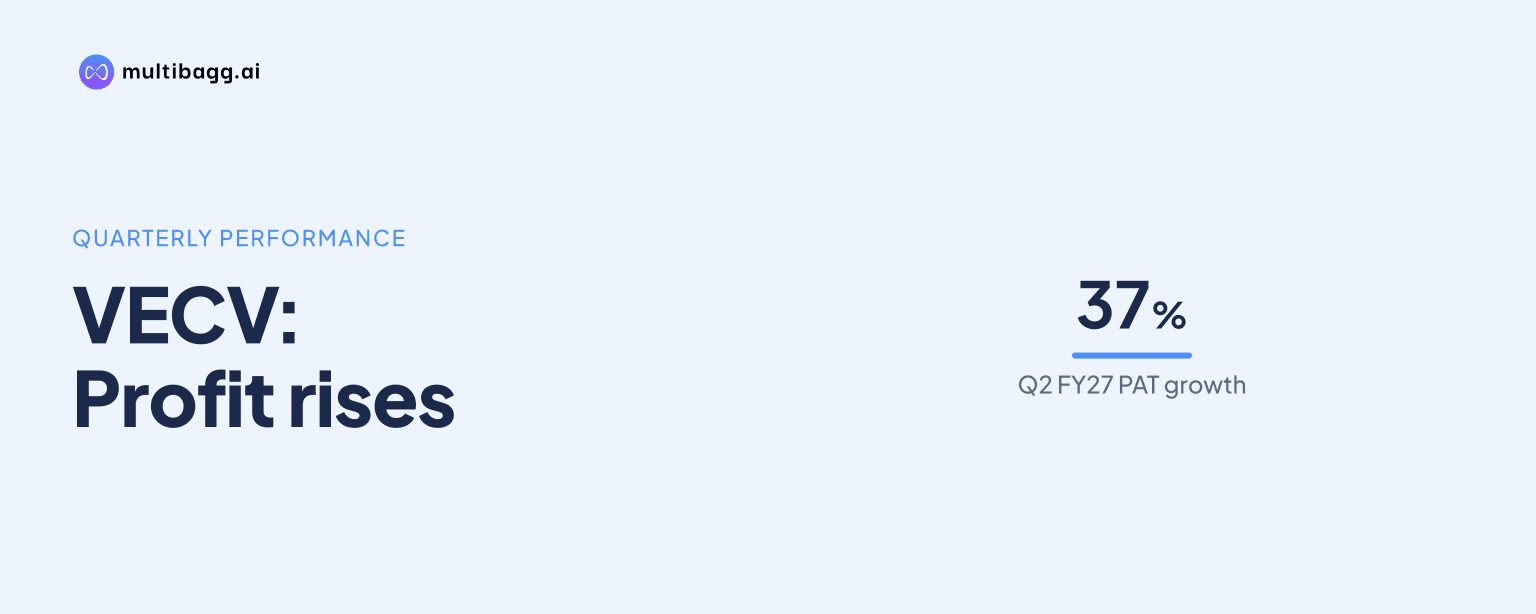
VE Commercial Vehicles reported Q2 FY27 profit after tax, including other comprehensive income, of Rs 342 crore, up 37.0% year on year, as revenue from operations rose 24.0% to Rs 7,569 crore. VECV’s H1 FY27 EBITDA margin, however, declined 50 basis points to 8.1% despite revenue growth of 20.4%.
Know Eicher Motors inside out
Results, valuation, peers and who's buying, in one view.
How did VECV perform in Q2 FY27?
VECV increased revenue, EBITDA and PAT in Q2 FY27, with PAT rising faster than revenue. Revenue from operations increased to Rs 7,569 crore from Rs 6,106 crore in Q2 FY26, while earnings before interest, tax, depreciation and amortisation, or EBITDA, rose 22.7% to Rs 588 crore from Rs 479 crore. EBITDA margin increased 10 basis points to 8.0% from 7.9%.
Total volume above 2.0 tonnes rose 28.2% to 28,071 units in Q2 FY27 from 21,901 units a year earlier. PAT including other comprehensive income, or OCI, increased by Rs 93 crore to Rs 342 crore from Rs 249 crore. The presentation states that EBITDA is calculated using operating income only.
What changed in VECV’s H1 FY27 margin?
VECV’s H1 FY27 EBITDA margin fell to 8.1% from 8.6% in H1 FY26, a decline of 50 basis points. EBITDA rose 14.1% to Rs 1,129 crore from Rs 989 crore, but this was below the 20.4% increase in revenue from operations to Rs 14,179 crore. One basis point equals one-hundredth of a percentage point.
H1 FY27 volumes increased 21.5% to 52,886 units from 43,511 units in H1 FY26, while PAT including OCI grew 19.4% to Rs 642 crore from Rs 537 crore. Q2 margin moved up to 8.0% from 7.9%, in contrast with the H1 margin decline, but the presentation does not disclose a reason for the half-year margin movement.
Which vehicle segments drove VECV’s Q2 growth?
VECV’s 2.0-3.5 tonne small commercial vehicle segment recorded the fastest Q2 FY27 percentage volume growth, while light and medium-duty trucks added the most units among listed segments. Small commercial vehicle volume rose 622.5% to 1,763 units from 244 units, and light and medium-duty truck volume increased 28.5% to 12,969 units from 10,096 units.
Heavy-duty truck sales rose 29.4% to 6,962 units, while light and medium-duty bus volume increased 11.4% to 3,169 units. Total bus sales rose 8.9% to 3,503 units, although heavy-duty bus sales declined 10.2% to 334 units. Exports declined 5.9% to 1,715 units from 1,823 units.
Got a follow-up? Ask IRIS
How did VECV’s market shares move in Q2 FY27?
VECV recorded lower market shares in several major Q2 FY27 vehicle categories despite higher unit sales. Its light and medium-duty truck share fell to 33.6% from 34.8%, while heavy-duty truck share declined to 8.8% from 9.5%. VECV’s share for vehicles above 2.0 tonnes was 10.2%, compared with 10.3% a year earlier.
The bus mix showed different movements across categories. Light and medium-duty bus share increased to 21.0% from 20.2%, but total bus share fell to 15.2% from 16.2% and heavy-duty bus share declined to 4.2% from 6.5%. Small commercial vehicle share rose to 1.5% from 0.3% as volume increased to 1,763 units.
How does H1 FY27 compare with VECV’s annual record?
VECV’s H1 FY27 revenue from operations of Rs 14,178.5 crore was more than half of FY26 revenue of Rs 27,076.6 crore, while H1 sales volume was 52,886 units against FY26 volume of 103,404 units. The periods are not directly comparable because H1 FY27 covers six months and FY26 covers a full financial year.
The consolidated profit and loss statement reported H1 FY27 profit for the period of Rs 649.9 crore and profit before tax of Rs 862.8 crore. Raw-material and component consumption was Rs 9,538.6 crore, purchases of traded goods were Rs 1,763.9 crore, employee benefits expense was Rs 930.3 crore and other expenses were Rs 1,354.8 crore. The separate financial-highlights page reports PAT including OCI of Rs 642 crore, so the two profit measures should not be treated as identical.
FY26 revenue from operations of Rs 27,076.6 crore exceeded Rs 23,548.2 crore in FY25 and Rs 21,868.0 crore in FY24. FY26 profit for the year was Rs 1,466.6 crore, compared with Rs 1,286.4 crore in FY25. VECV also reported H1 FY27 market positions of 33.4% in light and medium-duty trucks, 19.6% in combined buses and 9.4% in combined heavy-duty trucks.
Conclusion
VECV translated Q2 FY27 volume growth of 28.2% and revenue growth of 24.0% into a 37.0% increase in PAT including OCI to Rs 342 crore. The H1 FY27 result also showed higher revenue, volumes and PAT, but EBITDA growth of 14.1% trailed revenue growth of 20.4%, reducing the EBITDA margin to 8.1% from 8.6%.
The key unresolved matter is the reason for the 50-basis-point H1 margin decline, which VECV did not explain in the presentation. Future disclosures will show whether the Q2 FY27 margin of 8.0%, the H1 FY27 light and medium-duty truck share of 33.4%, and the H1 FY27 total-bus share of 18.8% change further.